Three Step Future-Trend [BigBeluga] for ThinkOrSwim

samer800

Moderator - Expert
VIP
Lifetime
mod note: Schwab does not update InertiaALL in real time; therefore this script will lag.
https://usethinkscript.com/threads/...in-real-time-in-thinkorswim.8794/#post-116082

TrADAaN.png

Author Message:
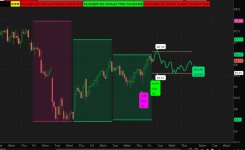
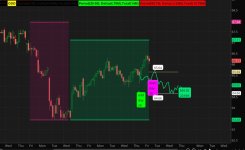
Three Step Future-Trend by BigBeluga is a forward-looking trend analysis tool designed to project potential future price direction based on historical periods. This indicator aggregates data from three consecutive periods, using price averages and delta volume analysis to forecast trend movement and visualize it on the chart with a projected trend line and volume metrics.
https://www.tradingview.com/script/ay15DZnZ-Three-Step-Future-Trend-BigBeluga/


CODE:

CSS:
# Indicator for TOS
#// © BigBeluga
# indicator('Three Step Future-Trend [BigBeluga]', overlay = true)
# Converted by Sam4Cok@Samer800    - 12/2024

input FutureTrendPlotType = {Default "Line", "Candels", "Don't Show"};
input labelOptions = {Default "Label & Bubble", "Label Only", "Bubble Only", "Don't Show"};
input src = close;
input period = 25; #, 'Period')
input highLowLength = 50;

def na = Double.NaN;
def last = isNaN(close);
def line = FutureTrendPlotType == FutureTrendPlotType."Line";
def candle = FutureTrendPlotType == FutureTrendPlotType."Candels";
def lab = labelOptions == labelOptions."Label Only" or labelOptions == labelOptions."Label & Bubble";
def bub = labelOptions == labelOptions."Bubble Only" or labelOptions == labelOptions."Label & Bubble";
#-- color
DefineGlobalColor("up", CreateColor(0, 230, 118));
DefineGlobalColor("dn", CreateColor(212, 37, 131));
DefineGlobalColor("dup", CreateColor(0, 112, 58));
DefineGlobalColor("ddn", CreateColor(112, 20, 69));

def hh = highest(high, highLowLength);
def ll = lowest(low, highLowLength);

def volUp = if close > open then volume else 0;
def volDn = if close > open then 0 else volume;
def delta_vol = volUp - volDn;
def delta1 = sum(delta_vol, period);
def delta2 = sum(delta_vol, period)[period];
def delta3 = sum(delta_vol, period)[period * 2];
def total1 = sum(volume, period);
def total2 = sum(volume, period)[period];
def total3 = sum(volume, period)[period * 2];

def col1 = highestAll(inertiaAll(delta1, 2));
def col2 = highestAll(inertiaAll(delta2, 2));
def col3 = highestAll(inertiaAll(delta3, 2));

def hhL1 = inertiaAll(highestAll(inertiaAll(hh, 2)), period);
def llL1 = inertiaAll(lowestAll(inertiaAll(ll, 2)), period);
def hhL2 = inertiaAll(highestAll(inertiaAll(hh[period], 2)), period*2);
def llL2 = inertiaAll(lowestAll(inertiaAll(ll[period], 2)), period*2);
def hhL3 = inertiaAll(highestAll(inertiaAll(hh[period*2], 2)), period*3);
def llL3 = inertiaAll(lowestAll(inertiaAll(ll[period*2], 2)), period*3);

#  HH - LL
plot hhLine1 = hhL1;
plot llLine1 = llL1;
plot hhLine2 = if isNaN(hhL1) then hhL2 else na;
plot llLine2 = if isNaN(llL1) then llL2 else na;
plot hhLine3 = if (isNaN(hhL1) and isNaN(hhL2)) then hhL3 else na;
plot llLine3 = if (isNaN(llL1) and isNaN(llL2)) then llL3 else na;

hhLine1.SetLineWeight(2);
llLine1.SetLineWeight(2);
hhLine2.SetLineWeight(2);
llLine2.SetLineWeight(2);
hhLine3.SetLineWeight(2);
llLine3.SetLineWeight(2);
hhLine1.AssignValueColor(if col1 > 0 then GlobalColor("up") else GlobalColor("dn"));
hhLine2.AssignValueColor(if col2 > 0 then GlobalColor("up") else GlobalColor("dn"));
hhLine3.AssignValueColor(if col3 > 0 then GlobalColor("up") else GlobalColor("dn"));
llLine1.AssignValueColor(if col1 > 0 then GlobalColor("up") else GlobalColor("dn"));
llLine2.AssignValueColor(if col2 > 0 then GlobalColor("up") else GlobalColor("dn"));
llLine3.AssignValueColor(if col3 > 0 then GlobalColor("up") else GlobalColor("dn"));

AddCloud(if col1 > 0 then hhLine1 else na, llLine1, GlobalColor("dup"));
AddCloud(if col2 > 0 then hhLine2 else na, llLine2, GlobalColor("dup"));
AddCloud(if col3 > 0 then hhLine3 else na, llLine3, GlobalColor("dup"));
AddCloud(if col1 > 0 then na else hhLine1, llLine1, GlobalColor("ddn"));
AddCloud(if col2 > 0 then na else hhLine2, llLine2, GlobalColor("ddn"));
AddCloud(if col3 > 0 then na else hhLine3, llLine3, GlobalColor("ddn"));

#-- Future_trend Trend
def values = if last[-1] then (src[period] + src[period * 2] + src[period * 3]) / 3 else values[1];
def delta  = (delta_vol + delta_vol[period] + delta_vol[period * 2]) / 3;
def diff   = if !last then src - values else diff[1];
def vol_delta = if !last then Average(delta, period) else vol_delta[1];
def col = vol_delta;
def future_trend = if !last then close else if last then diff + values else na;

plot futureTrend = if line and last[-1] and future_trend then future_trend else na;
futureTrend.SetLineWeight(2);
futureTrend.AssignValueColor(if col > 0 then GlobalColor("up") else GlobalColor("dn"));

#-- Bubble
def bubCond = bub and isNaN(futureTrend[-1]) and !isNaN(futureTrend);
AddChartBubble(bubCond[1], futureTrend[1], AsDollars(futureTrend[1]) + "\n" + Round(vol_delta[1]/1000, 2) + "K",
               if col[1] > 0 then GlobalColor("up") else GlobalColor("dn"), if col[1] > 0 then no else yes);

#-- Candles
def valuesO = if last[-1] then (open [period] + open [period * 2] + open [period * 3]) / 3 else valuesO[1];
def valuesC = if last[-1] then (close[period] + close[period * 2] + close[period * 3]) / 3 else valuesC[1];

def diffO = if !last then open  - valuesO else diffO[1];
def diffC = if !last then close - valuesC else diffC[1];
def UpO  = if candle and last then diffO + valuesO else na;
def UpC  = if candle and last then diffC + valuesC else na;

def up = UpC > UpO;

AddChart(open = if up then UpC else na, high = UpC , low = UpO ,   close = UpO,
         type = ChartType.CANDLE, growcolor = GlobalColor("up"));

AddChart(open = if up then na else UpO, high = UpO , low = UpC ,   close = UpC,
         type = ChartType.CANDLE, growcolor = GlobalColor("dn"));

def CandCond = bub and isNaN(UpC[-1]) and !isNaN(UpC);
AddChartBubble(CandCond[1], UpC[1], AsDollars(UpC[1]) + "\n" + Round(vol_delta[1]/1000, 2) + "K",
               if col[1] > 0 then GlobalColor("up") else GlobalColor("dn"), if col[1] > 0 then no else yes);

#-- Labels
AddLabel(lab, "Period[0-" + period + "]: Delta(" + Round(delta1 / 1000000, 2) + "M)" +
            ",Total(" + Round(total1 / 1000000, 2) + "M)", if delta1 > 0 then Color.GREEN else Color.RED);
AddLabel(lab, "Period[" + period + "-"+ period*2 + "]: Delta(" + Round(delta2 / 1000000, 2) + "M)" +
            ",Total(" + Round(total2 / 1000000, 2) + "M)", if delta2 > 0 then Color.GREEN else Color.RED);
AddLabel(lab, "Period[" + period*2 + "-"+ period*3 + "]: Delta(" + Round(delta3 / 1000000, 2) + "M)" +
            ",Total(" + Round(total3 / 1000000, 2) + "M)", if delta3 > 0 then Color.GREEN else Color.RED);

#--END of CODE
 
Last edited by a moderator:

Join useThinkScript to post your question to a community of 21,000+ developers and traders.

is there a way to keep the last 2 or 3 predicted trends to see the quality of the predictions? To see if they were "right" in their assumptions? maybe produce a "fudge" factor to compensate? Maybe a high/low range plot would be beneficial? Based off the resulting deviation of past performances?
 
@Morris provided a workaround that will work.

No, neither a fudge factor nor a high/low range plot or backtesting will provide any useful analysis.

This indicator is predicated on trends and Newton's First Law.
The Trend will continue unless compelled to change its state by an external catalyst.
If there is no disrupter, this indicator will be accurate.

If there is a disrupter (i.e.: economic event, earnings, war, etc.), the trend will be disrupted.
How big the disruption will depend on how market sentiment views the disruption.

@enjoy2retire` @antwerks
 
Last edited by a moderator:
Please excuse my ignorance and also, I am not an options trader so I am not very familiar with the Greeks. Can someone please enlighten me as to what and how to interpret the "delta volume analysis" as they appear on the chart?

- Respectfully
 
Last edited:
is there a way to keep the last 2 or 3 predicted trends to see the quality of the predictions? To see if they were "right" in their assumptions? maybe produce a "fudge" factor to compensate? Maybe a high/low range plot would be beneficial? Based off the resulting deviation of past performances?

i had an idea... but i couldn't get it to work.
maybe someone who really understands inertiaall() might be able to make this work...
maybe enertia() needs to be used with date and time parameters?

i thought of making a study, that would calc things to the end of today, or to the end of yesterday.
..then load it twice,
..then in one, pick even day, in the other one, pick odd day.
..odd/even would correspond to today and yesterday.
it would find the last bar of the last (odd/even) day and do calculations up to that bar. and do similar in the other study.
i can find the last bars of the last 2 days.
a green bubble is on the desired day last bar. a purple bubble is on the other days bar.

but i couldn't modify lines like this, to work as i wanted,
def hhL1 = inertiaAll(highestAll(inertiaAll(hh, 2)), period);
there are several versions of code lines that i tried

the clouds and lines are not correct when stopped at yesterday. col1 doesn't work right (closest to the last bar)

i added hi lo lines, and bubbles on the predict line.


Code:
#future_trend_three_step_01_aaa_predict

#future_trend_three_step_aaa_predict
#future_trend_three_step

#https://usethinkscript.com/threads/three-step-future-trend-bigbeluga-for-thinkorswim.20148/
#Indicators Custom 
#Three Step Future-Trend [BigBeluga] for ThinkOrSwim
#samer800  Dec 14, 2024
#1

#mod note: Schwab does not update InertiaALL in real time; therefore this script will lag.
#https://usethinkscript.com/threads/...in-real-time-in-thinkorswim.8794/#post-116082

# Three Step Future-Trend by BigBeluga is a forward-looking trend analysis tool
#  designed to project potential future price direction
#   based on historical periods. 
# This indicator aggregates data from three consecutive periods, 
#  using price averages and delta volume analysis
#   to forecast trend movement and visualize it on the chart
#    with a projected trend line and volume metrics.
#https://www.tradingview.com/script/ay15DZnZ-Three-Step-Future-Trend-BigBeluga/


# Indicator for TOS
#// © BigBeluga
# indicator('Three Step Future-Trend [BigBeluga]', overlay = true)
# Converted by Sam4Cok@Samer800    - 12/2024


def na = double.nan;
def bn = barnumber();
def lastbn = highestall(if !isnan(close) then bn else 0);
def lastbar = (bn == lastbn);

input last_day_type = {default even , odd };

def dy = getday();
#  getday numbers skip weekends and holidays
# if a 3 day weekend, then fri & tue can both be odd
# make a day counter from newday, and use that for odd/even
def newday = dy != dy[1];

def dayz = if bn == 1 then 1
 else if newday then dayz[1] + 1
 else dayz[1];

def lastday = highestall(if !isnan(close) then dayz else 0);
def even = dayz/2 == floor(dayz/2);
def lastevenbn = highestall(if even and !isnan(close) then bn else 0);
def lastoddbn = highestall(if !even and !isnan(close) then bn else 0);

def daynum;
def lastdaybn;
switch (last_day_type) {
case even:
 daynum = 2;
 lastdaybn = lastevenbn;
case odd:
 daynum = 1;
 lastdaybn = lastoddbn;
}


addchartbubble(bn == lastoddbn, low*0.99,
"odd\n" +
"day\n" +
dayz
, (if daynum == 1 then color.green else if daynum == 2 then color.magenta else color.gray), no);

addchartbubble(bn == lastevenbn, low*0.99,
"even\n" +
"day\n" +
dayz
, (if daynum == 2 then color.green else if daynum == 1 then color.magenta else color.gray), no);


def lastx = dayz == lastday or (dayz+1) == lastday or (dayz+2) == lastday or (dayz-1) == lastday;

addchartbubble(0 and lastx, low*0.98,
 dayz + " Dz\n" +
 even + " E\n" +
 bn + " bn\n" +
 lastevenbn + " E\n" +
 lastoddbn + " O\n" +
 lastdaybn
,    (if lastevenbn == bn and daynum == 2 then color.green
 else if lastoddbn  == bn and daynum == 1 then color.green
 else if lastevenbn == bn and daynum == 1 then color.magenta
 else if lastoddbn  == bn and daynum == 2 then color.magenta
 else color.gray), no);


addlabel(1, (if daynum == 1 then "ODD" else "EVEN"), color.yellow);


#-----------------------------

input FutureTrendPlotType = {Default "Line", "Candels", "Don't Show"};
input labelOptions = {Default "Label & Bubble", "Label Only", "Bubble Only", "Don't Show"};
#input src = close;
def src = if  bn <= lastdaybn then close else na;
input period = 25; #, 'Period')
input highLowLength = 50;


def o = if bn <= lastdaybn then open else na;
def h = if bn <= lastdaybn then high else na;
def l = if bn <= lastdaybn then low else na;
def c = if bn <= lastdaybn then close else na;
def v = if bn <= lastdaybn then volume else na;


#def na = Double.NaN;
#def last = isNaN(close);
def last = isNaN(close) or bn > lastdaybn;

def line = FutureTrendPlotType == FutureTrendPlotType."Line";
def candle = FutureTrendPlotType == FutureTrendPlotType."Candels";
def lab = labelOptions == labelOptions."Label Only" or labelOptions == labelOptions."Label & Bubble";
def bub = labelOptions == labelOptions."Bubble Only" or labelOptions == labelOptions."Label & Bubble";
#-- color
DefineGlobalColor("up", CreateColor(0, 230, 118));
DefineGlobalColor("dn", CreateColor(212, 37, 131));
DefineGlobalColor("dup", CreateColor(0, 112, 58));
DefineGlobalColor("ddn", CreateColor(112, 20, 69));

def hh = highest(h, highLowLength);
def ll = lowest(l, highLowLength);

def volUp = if c > o then v else 0;
def volDn = if c > o then 0 else v;
def delta_vol = volUp - volDn;
def delta1 = sum(delta_vol, period);
def delta2 = sum(delta_vol, period)[period];
def delta3 = sum(delta_vol, period)[period * 2];
def total1 = sum(v, period);
def total2 = sum(v, period)[period];
def total3 = sum(v, period)[period * 2];


def col1 = highestAll(inertiaAll(delta1, 2));
def col2 = highestAll(inertiaAll(delta2, 2));
def col3 = highestAll(inertiaAll(delta3, 2));

#def col1 = if bn <= lastdaybn then highestAll(inertiaAll(delta1, 2)) else na;
#def col2 = if bn <= lastdaybn then highestAll(inertiaAll(delta2, 2)) else na;
#def col3 = if bn <= lastdaybn then highestAll(inertiaAll(delta3, 2)) else na;

#def col1 = highestAll(if bn <= lastdaybn then inertiaAll(delta1, 2) else 0);
#def col2 = highestAll(if bn <= lastdaybn then inertiaAll(delta2, 2) else 0);
#def col3 = highestAll(if bn <= lastdaybn then inertiaAll(delta3, 2) else 0);

def hhL1 = inertiaAll(highestAll(inertiaAll(hh, 2)), period);
def llL1 = inertiaAll(lowestAll(inertiaAll(ll, 2)), period);
def hhL2 = inertiaAll(highestAll(inertiaAll(hh[period], 2)), period*2);
def llL2 = inertiaAll(lowestAll(inertiaAll(ll[period], 2)), period*2);
def hhL3 = inertiaAll(highestAll(inertiaAll(hh[period*2], 2)), period*3);
def llL3 = inertiaAll(lowestAll(inertiaAll(ll[period*2], 2)), period*3);


#def hhL1 = inertiaAll(highestAll(if bn <= lastdaybn then inertiaAll(hh, 2) else 0), period);
#def llL1 = inertiaAll(lowestAll(if bn <= lastdaybn then inertiaAll(ll, 2) else 0), period);
##def hhL2 = if bn <= lastdaybn then inertiaAll(highestAll(inertiaAll(hh[period], 2)), period*2) else na;
#def hhL2 = inertiaAll(highestAll(if bn <= lastdaybn then inertiaAll(hh[period], 2) else 0), period*2);
#def llL2 = inertiaAll(lowestAll(if bn <= lastdaybn then inertiaAll(ll[period], 2) else 0), period*2);
#def hhL3 = inertiaAll(highestAll(if bn <= lastdaybn then inertiaAll(hh[period*2], 2) else 0), period*3);
#def llL3 = inertiaAll(lowestAll(if bn <= lastdaybn then inertiaAll(ll[period*2], 2) else 0), period*3);


addchartbubble(0, low*0.99,
hh + " hh\n" +
ll + " ll\n" +
#volup + "\n" +
#voldn + "\n" +
#delta_vol + "\n" +
#delta1 + "\n" +
#delta2 + "\n" +
#delta3 + "\n" +
#total1 + "\n" +
#total2 + "\n" +
#total3 + "\n" +
col1 + " c1\n" +
col2 + " c2\n" +
col3 + " c3\n" +
hhl1 + " hh1\n" +
lll1 + " ll1\n" +
hhl2 + " hh2\n" +
lll2 + " ll2\n" +
hhl3 + " hh3\n" +
lll3 + " ll3\n" 
, color.yellow, no);


#  1 is close to last bar
#  3 is far from last bar

#  HH - LL
plot hhLine1 = hhL1;
plot llLine1 = llL1;
plot hhLine2 = if isNaN(hhL1) then hhL2 else na;
plot llLine2 = if isNaN(llL1) then llL2 else na;
plot hhLine3 = if (isNaN(hhL1) and isNaN(hhL2)) then hhL3 else na;
plot llLine3 = if (isNaN(llL1) and isNaN(llL2)) then llL3 else na;


addchartbubble(0, low*0.99,
hhline1 + "\n" +
llline1 + "\n" +
hhline2 + "\n" +
llline2 + "\n" +
hhline3 + "\n" +
llline3 + "\n" 
, color.yellow, no);


hhLine1.SetLineWeight(2);
llLine1.SetLineWeight(2);
hhLine2.SetLineWeight(2);
llLine2.SetLineWeight(2);
hhLine3.SetLineWeight(2);
llLine3.SetLineWeight(2);
hhLine1.AssignValueColor(if col1 > 0 then GlobalColor("up") else GlobalColor("dn"));
hhLine2.AssignValueColor(if col2 > 0 then GlobalColor("up") else GlobalColor("dn"));
hhLine3.AssignValueColor(if col3 > 0 then GlobalColor("up") else GlobalColor("dn"));
llLine1.AssignValueColor(if col1 > 0 then GlobalColor("up") else GlobalColor("dn"));
llLine2.AssignValueColor(if col2 > 0 then GlobalColor("up") else GlobalColor("dn"));
llLine3.AssignValueColor(if col3 > 0 then GlobalColor("up") else GlobalColor("dn"));

AddCloud(if col1 > 0 then hhLine1 else na, llLine1, GlobalColor("dup"));
AddCloud(if col2 > 0 then hhLine2 else na, llLine2, GlobalColor("dup"));
AddCloud(if col3 > 0 then hhLine3 else na, llLine3, GlobalColor("dup"));
AddCloud(if col1 > 0 then na else hhLine1, llLine1, GlobalColor("ddn"));
AddCloud(if col2 > 0 then na else hhLine2, llLine2, GlobalColor("ddn"));
AddCloud(if col3 > 0 then na else hhLine3, llLine3, GlobalColor("ddn"));

#-- Future_trend Trend
def values = if last[-1] then (src[period] + src[period * 2] + src[period * 3]) / 3 else values[1];
def delta  = (delta_vol + delta_vol[period] + delta_vol[period * 2]) / 3;
def diff   = if !last then src - values else diff[1];
def vol_delta = if !last then Average(delta, period) else vol_delta[1];
def col = vol_delta;
def future_trend = if !last then c else if last then diff + values else na;

plot futureTrend = if line and last[-1] and future_trend then future_trend else na;
futureTrend.SetLineWeight(2);
futureTrend.AssignValueColor(if col > 0 then GlobalColor("up") else GlobalColor("dn"));

#-- Bubble
def bubCond = bub and isNaN(futureTrend[-1]) and !isNaN(futureTrend);
AddChartBubble(bubCond[1], futureTrend[1], AsDollars(futureTrend[1]) + "\n" + Round(vol_delta[1]/1000, 2) + "K",
               if col[1] > 0 then GlobalColor("up") else GlobalColor("dn"), if col[1] > 0 then no else yes);

#-- Candles
def valuesO = if last[-1] then (o[period] + o[period * 2] + o[period * 3]) / 3 else valuesO[1];
def valuesC = if last[-1] then (c[period] + c[period * 2] + c[period * 3]) / 3 else valuesC[1];

def diffO = if !last then o - valuesO else diffO[1];
def diffC = if !last then c - valuesC else diffC[1];
def UpO  = if candle and last then diffO + valuesO else na;
def UpC  = if candle and last then diffC + valuesC else na;

def up = UpC > UpO;

AddChart(open = if up then UpC else na, high = UpC , low = UpO ,   close = UpO,
         type = ChartType.CANDLE, growcolor = GlobalColor("up"));

AddChart(open = if up then na else UpO, high = UpO , low = UpC ,   close = UpC,
         type = ChartType.CANDLE, growcolor = GlobalColor("dn"));

def CandCond = bub and isNaN(UpC[-1]) and !isNaN(UpC);
AddChartBubble(CandCond[1], UpC[1], AsDollars(UpC[1]) + "\n" + Round(vol_delta[1]/1000, 2) + "K",
               if col[1] > 0 then GlobalColor("up") else GlobalColor("dn"), if col[1] > 0 then no else yes);

#-- Labels
AddLabel(lab, "Period[0-" + period + "]: Delta(" + Round(delta1 / 1000000, 2) + "M)" +
            ",Total(" + Round(total1 / 1000000, 2) + "M)", if delta1 > 0 then Color.GREEN else Color.RED);
AddLabel(lab, "Period[" + period + "-"+ period*2 + "]: Delta(" + Round(delta2 / 1000000, 2) + "M)" +
            ",Total(" + Round(total2 / 1000000, 2) + "M)", if delta2 > 0 then Color.GREEN else Color.RED);
AddLabel(lab, "Period[" + period*2 + "-"+ period*3 + "]: Delta(" + Round(delta3 / 1000000, 2) + "M)" +
            ",Total(" + Round(total3 / 1000000, 2) + "M)", if delta3 > 0 then Color.GREEN else Color.RED);

#--END of CODE

#----------------------------

# find hihi and lolo  on prediction line , futureTrend

#def na = double.nan;
#def bn = barnumber();
#def lastbar = (!isnan(close) and isnan(close));
#def lastbn = highestall(if !isnan(close) then bn else 0);
#def lastbar = (bn == lastbn);


def p = 300;
def big = 99999;

def hihi;
if bn == 1 or isnan(futureTrend) then {
 hihi = 0;
} else if lastbar then {
 hihi = fold m = 0 to p
  with n = 0
  while !isnan(getvalue(futureTrend,-m))
  do max(n,getvalue(futureTrend,-m));
} else {
 hihi = hihi[1];
}

def lolo;
if bn == 1 or isnan(futureTrend) then {
#if !lastbar[0] then {
 lolo = 0;
} else if lastbar then {
 lolo = fold i = 0 to p
  with j = big
  while !isnan(getvalue(futureTrend,-i))
  do min(j,getvalue(futureTrend,-i));
} else {
 lolo = lolo[1];
}

plot hix = if hihi > 0 then hihi else na;
plot lox = if lolo > 0 then lolo else na;

addchartbubble((bn == lastbn + 3), hihi, round(hihi,2), color.white, yes);
addchartbubble((bn == lastbn + 3), lolo, round(lolo,2), color.white, no);


addchartbubble(0, 347,
futuretrend + "\n" +
hihi + "\n" +
lolo
, color.yellow, no);
#
 

Attachments

  • 01d-even.JPG
    01d-even.JPG
    92.2 KB · Views: 494
  • 01d-odd.JPG
    01d-odd.JPG
    90.8 KB · Views: 501
@sam082000, or anyone else...

hi -

I was wondering how to write the script for the prediction line to show up as a label. The extra 26 space is driving me a little batty, but I understand the reason/calculations behind it.

I kept playing around with it and it came up with "FutureNaN"

This is what I added, and it basically doubled up the bubbles and then gave me the FutureNaN text.

AddLabel(yes, "Future"+ AsDollars(UpC[1]));

I found the bubble script, and I tried and failed :confused:

AddChartBubble(bubCond[1], futureTrend[1], AsDollars(futureTrend[1]) + "\n" + Round(vol_delta[1]/1000, 2) + "K",
if col[1] > 0 then GlobalColor("up") else GlobalColor("dn"), if col[1] > 0 then no else yes);


thanks,
jrj4774

1769460818137.png
 
Last edited by a moderator:
For me its not so much about the end as it is the path, especially in helping me time entries and exits. Not saying its always correct and it does repaint as it "predicts" but looking at AAPL for instance it has been very good at letting me know ranges. So what exactly are you wanting to get out of it, like input number of days and it gives you the predicted value/price point?
 
For me its not so much about the end as it is the path, especially in helping me time entries and exits. Not saying its always correct and it does repaint as it "predicts" but looking at AAPL for instance it has been very good at letting me know ranges. So what exactly are you wanting to get out of it, like input number of days and it gives you the predicted value/price point?
@antwerks Nothing that complicated, but that would be nice idea. I just want the bubble price range to be as a label so I can see it without having to zoom out to see it.

Sometimes, that bubble is so far off the bottom right side of the chart ( I know I should not trade it, but I'm curious into how far it will bleed).

Yes I am using it as price range.

Curious question, I see you have these as indictor shortcuts, how do I get these as pinned too?

1769468186309.png


Thanks,
jrj4774
 
@antwerks Nothing that complicated, but that would be nice idea. I just want the bubble price range to be as a label so I can see it without having to zoom out to see it.

Sometimes, that bubble is so far off the bottom right side of the chart ( I know I should not trade it, but I'm curious into how far it will bleed).

Yes I am using it as price range.

Curious question, I see you have these as indictor shortcuts, how do I get these as pinned too?

View attachment 26900


Thanks,
jrj4774
That “tack” on the left circled is the Study Set button. It controls whether your study header (all those script names across the top of the chart) is visible and whether it stays pinned.

Part 1 – Show the script header with the tack
  1. Go to your chart.
  2. Click the little tack / pin icon at the top right of the chart.
  3. When it is blue, the study header stays visible.
  4. When it is gray, it auto-hides.
So:
  • Gray tack → header hides
  • Blue tack → header stays shown
    That’s what makes all your scripts (GHLA, CONTANGO, Trend Engine, etc.) appear in that bar.

Part 2 – Saving scripts into that header (Study Set)

That header is your Study Set.
Think of it as a “workspace” of all active indicators on that chart.

To save everything currently loaded:
  1. Click the Studies (beaker icon) in the upper right.
  2. Click Save Study Set…
  3. Give it a name like: (as examples, you put your own "names")
    • AntWerks_TrendEngine
    • AntWerks_ExitSystem
    • Daily_Swing_Core

Now every script you have loaded becomes part of that set.

Later, to load it:
  1. Studies (beaker)
  2. Load Study Set…
  3. Pick your saved set

Instantly restores:
  • All your scripts
  • All colors
  • All settings
  • All dashboard labels
  • All bubbles
Part 3 – Saving individual scripts so they appear in Studies

For any custom script:
  1. Studies → Edit Studies
  2. Go to the Studies tab
  3. Scroll to My Studies
  4. Right-click → Create… (or edit existing)
  5. Paste your code
  6. Give it a name
  7. Click OK
Now that script can be added to any chart and will show in your header when active.

How I like to organize my header Study Sets
  • Think of it like a car:

    • Core Trend Engine = engine
    • Momentum = transmission
    • Volume = fuel system
    • Take-profit logic = brakes
    • Scanners = navigation system
    Without the engine, the rest has no context.

Each one is a complete trading “brain”.
Your system hierarchy now looks like this: (using some personal scripts as examples, you can load your own that meets these definitions of purpose)

  1. Core Trend Engine
    → Determines directional permission
  2. Probability + Momentum Model
    → Determines statistical continuation
  3. RSR / RSI Systems
    → Selects the best stocks
  4. Take Profit Engine (Optimized)
    → Manages exits professionally
  5. Volume Radar
    → Confirms institutional sponsorship

Each module has one job.
The Core Trend Engine is the boss.
When you load a set, your header becomes your trading dashboard.
That tack makes it visible, and those names become your control panel.
1769473063676.png
 

Similar threads

Not the exact question you're looking for?

Start a new thread and receive assistance from our community.

87k+ Posts
700 Online
Create Post

Similar threads

Similar threads

The Market Trading Game Changer

Join 2,500+ subscribers inside the useThinkScript VIP Membership Club
  • Exclusive indicators
  • Proven strategies & setups
  • Private Discord community
  • ‘Buy The Dip’ signal alerts
  • Exclusive members-only content
  • Add-ons and resources
  • 1 full year of unlimited support

Frequently Asked Questions

What is useThinkScript?

useThinkScript is the #1 community of stock market investors using indicators and other tools to power their trading strategies. Traders of all skill levels use our forums to learn about scripting and indicators, help each other, and discover new ways to gain an edge in the markets.

How do I get started?

We get it. Our forum can be intimidating, if not overwhelming. With thousands of topics, tens of thousands of posts, our community has created an incredibly deep knowledge base for stock traders. No one can ever exhaust every resource provided on our site.

If you are new, or just looking for guidance, here are some helpful links to get you started.

What are the benefits of VIP Membership?
VIP members get exclusive access to these proven and tested premium indicators: Buy the Dip, Advanced Market Moves 2.0, Take Profit, and Volatility Trading Range. In addition, VIP members get access to over 50 VIP-only custom indicators, add-ons, and strategies, private VIP-only forums, private Discord channel to discuss trades and strategies in real-time, customer support, trade alerts, and much more. Learn all about VIP membership here.
How can I access the premium indicators?
To access the premium indicators, which are plug and play ready, sign up for VIP membership here.
Back
Top