Supply and Demand Candles for ThinkorSwim

BenTen

Administrative
Staff member
Staff
VIP
Lifetime
The ancient laws of Supply and Demand are about how much of a stock or asset is available and how many buyers want it.

This indicator uses the ATR to define whether the price level is out of balance, indicating there might be a significant move about to happen --exciting zone. Or if they are in balance --boring zone.

Notes by the original developer:
This Script helps you identify the basing and explosive candles which can be used for Supply and Demand Analysis methodology
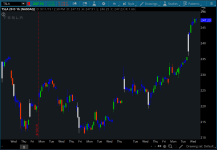
  • Blue Candle represents the Boring Candles ==> Demand and Supply is in balance
  • Black Candle (the one in ThinkorSwim is white) represents the Exciting Candles ==> imbalance between Demand and Supply

7TScVaY.png


thinkScript Code

Code:
# Supply and Demand Candles
# Assembled by BenTen at useThinkScript.com
# Converted from https://www.tradingview.com/script/KRlFYBWy-Demand-and-Supply-Candles-open/

input Sensitivity = 1.5;
def Candle_Range = high - low;
def Body_Range = AbsValue(close - open);
def Bar_Lookback = 100;
def Volatility = atr(Bar_Lookback);
def Strength = Volatility * Sensitivity;
def Exciting = (Body_Range > Candle_Range* 0.6) and (Candle_Range >= Strength);
def Boring = Body_Range <= Candle_Range * 0.5;
assignPriceColor(if Exciting then Color.WHITE else if Boring then Color.Blue else Color.Current);
 

Attachments

  • 7TScVaY.png
    7TScVaY.png
    68.8 KB · Views: 222
Last edited by a moderator:

Join useThinkScript to post your question to a community of 21,000+ developers and traders.

@tradeimbalances This study is not a strategy in itself upon which one can measure 'success'. This indicator might have some validity as part of your existing overall strategy.

The ancient laws of Supply and Demand is the amount of an instrument that is available and the desire of buyers for it, drive the price. It identifies zones on the chart where demand overwhelms supply (the demand zone), driving the price up or where supply overwhelms demand (the supply zone), driving the price down. If this indicator is not in a 'boring' zone, supply and demand are not in balance, lending credence to your strategy that something is going to happen.
 
@Six6God This study identifies 'boring' and 'exciting' zones. If the equity does not have any boring or exciting zones at the moment. There will not be anything to see.
 
Hi all,

How do I set that the boring candle body is 50% smaller than the whole body include the wick. It means the shaded part of the candle that have body less than 50% of the candle range.?

Mark a candle blue if its body (open-close) is less than 50% of candle size ( high-low )

Here is the pinescript. Can someone convert?

study("Boring Candle", overlay=true)
candleColor = ( abs(open-close)/abs(high-low) > 0.5 )? (open < close ? green : red) : blue
plotcandle(open, high, low, close, color = candleColor)
 
Last edited by a moderator:
def Boring = Body_Range <= Candle_Range * 0.5;
Hi all,

How do I set that the boring candle body is 50% smaller than the whole body include the wick. It means the shaded part of the candle that have body less than 50% of the candle range.?

Mark a candle blue if its body (open-close) is less than 50% of candle size ( high-low )

Here is the pinescript. Can someone convert?

study("Boring Candle", overlay=true)
candleColor = ( abs(open-close)/abs(high-low) > 0.5 )? (open < close ? green : red) : blue
plotcandle(open, high, low, close, color = candleColor)
Code:
# #######################################
plot boringCandle = absValue(open-close) /absValue(high-low) > 0.5  ;
boringCandle.hide();
AssignPriceColor(if boringcandle then color.blue else color.current);
# #######################################
 
Hi @MerryDay , some time of this fantastic thread.

I use supply/demand/imbalance on my trading and although is hard to master, i think is a great view of the market and let you predict some great reversals.

Is there a way to scan for this exciting candles?? i tried myself but im unable to create a scanner.

Thank you so much guys
Add to the bottom of your study. Select your study in the Scan hacker. Filter is: scan is true
Code:
plot scan = exciting ;
scan.hide();
 
in case this helps or want to use. I noticed Merry added a Supply/Demand Candle script (https://usethinkscript.com/threads/supply-and-demand-candles-for-thinkorswim.652/#post-97196)
i have modified this to use MTF to have a horizontal .10 zone plotted
Code:
# Supply and Demand Candles
# Assembled by BenTen at useThinkScript.com
# Converted from https://www.tradingview.com/script/KRlFYBWy-Demand-and-Supply-Candles-open/
input aggPeriod = AggregationPeriod.FIFTEEN_MIN;
def h = high(period = aggPeriod);
def l = low(period = aggPeriod);
def c = close(period = aggPeriod);
def o = open(period = aggPeriod);
input Sensitivity = 1.5;
input range = .05;
def Candle_Range = h - l;
def Body_Range = AbsValue(c - o);
def Bar_Lookback = 100;
def Volatility = ATR(Bar_Lookback);
def Strength = Volatility * Sensitivity;
def Exciting = (Body_Range > Candle_Range * 0.6) and (Candle_Range >= Strength);
def Boring = Body_Range <= Candle_Range * 0.5;
def excitingcolor = if c > o then 1 else 0;


def hc0 = if Exciting  then o  else  hc0[1];
plot  hc = hc0;
plot hch =   hc + range ;
plot hcl = hc - range ;
 
 
hc.SetPaintingStrategy(PaintingStrategy.HORIZONTAL);
hc.AssignValueColor( if excitingcolor == 1  then color.blue  else if excitingcolor == 0 then  color.red else Color.CURRENT);

hch.SetPaintingStrategy(PaintingStrategy.HORIZONTAL);
hch.AssignValueColor( color.gray);

hcl.SetPaintingStrategy(PaintingStrategy.HORIZONTAL);
hcl.AssignValueColor( color.gray);
#def hcolor = if excitingcolor == 1  then color.light_green else if excitingcolor == 0 then  color.light_red else Color.CURRENT;
AddCloud(hch,hcl,  color.cyan, color.green);
Hey there, Thank you so much for coding this. This is FANTASTIC!!! It has definitely helped me spot the major levels I look for since I trade Supply and Demand. This works great with the chart time I prefer to trade on without having to actually change the time frame since this is a multi time frame indicator you made. (don't get me wrong, Ill still change the time frame on the graph to check my work). Thank you so much!
 
in case this helps or want to use. I noticed Merry added a Supply/Demand Candle script (https://usethinkscript.com/threads/supply-and-demand-candles-for-thinkorswim.652/#post-97196)
i have modified this to use MTF to have a horizontal .10 zone plotted
Code:
# Supply and Demand Candles
# Assembled by BenTen at useThinkScript.com
# Converted from https://www.tradingview.com/script/KRlFYBWy-Demand-and-Supply-Candles-open/
input aggPeriod = AggregationPeriod.FIFTEEN_MIN;
def h = high(period = aggPeriod);
def l = low(period = aggPeriod);
def c = close(period = aggPeriod);
def o = open(period = aggPeriod);
input Sensitivity = 1.5;
input range = .05;
def Candle_Range = h - l;
def Body_Range = AbsValue(c - o);
def Bar_Lookback = 100;
def Volatility = ATR(Bar_Lookback);
def Strength = Volatility * Sensitivity;
def Exciting = (Body_Range > Candle_Range * 0.6) and (Candle_Range >= Strength);
def Boring = Body_Range <= Candle_Range * 0.5;
def excitingcolor = if c > o then 1 else 0;


def hc0 = if Exciting  then o  else  hc0[1];
plot  hc = hc0;
plot hch =   hc + range ;
plot hcl = hc - range ;
 
 
hc.SetPaintingStrategy(PaintingStrategy.HORIZONTAL);
hc.AssignValueColor( if excitingcolor == 1  then color.blue  else if excitingcolor == 0 then  color.red else Color.CURRENT);

hch.SetPaintingStrategy(PaintingStrategy.HORIZONTAL);
hch.AssignValueColor( color.gray);

hcl.SetPaintingStrategy(PaintingStrategy.HORIZONTAL);
hcl.AssignValueColor( color.gray);
#def hcolor = if excitingcolor == 1  then color.light_green else if excitingcolor == 0 then  color.light_red else Color.CURRENT;
AddCloud(hch,hcl,  color.cyan, color.green);
Thanks buddy. Setting this to a higher time on a much lower time chart appears to clear up quite a bit of noise. Cant wait to try it in real time.
 

Similar threads

Not the exact question you're looking for?

Start a new thread and receive assistance from our community.

87k+ Posts
531 Online
Create Post

Similar threads

Similar threads

The Market Trading Game Changer

Join 2,500+ subscribers inside the useThinkScript VIP Membership Club
  • Exclusive indicators
  • Proven strategies & setups
  • Private Discord community
  • ‘Buy The Dip’ signal alerts
  • Exclusive members-only content
  • Add-ons and resources
  • 1 full year of unlimited support

Frequently Asked Questions

What is useThinkScript?

useThinkScript is the #1 community of stock market investors using indicators and other tools to power their trading strategies. Traders of all skill levels use our forums to learn about scripting and indicators, help each other, and discover new ways to gain an edge in the markets.

How do I get started?

We get it. Our forum can be intimidating, if not overwhelming. With thousands of topics, tens of thousands of posts, our community has created an incredibly deep knowledge base for stock traders. No one can ever exhaust every resource provided on our site.

If you are new, or just looking for guidance, here are some helpful links to get you started.

What are the benefits of VIP Membership?
VIP members get exclusive access to these proven and tested premium indicators: Buy the Dip, Advanced Market Moves 2.0, Take Profit, and Volatility Trading Range. In addition, VIP members get access to over 50 VIP-only custom indicators, add-ons, and strategies, private VIP-only forums, private Discord channel to discuss trades and strategies in real-time, customer support, trade alerts, and much more. Learn all about VIP membership here.
How can I access the premium indicators?
To access the premium indicators, which are plug and play ready, sign up for VIP membership here.
Back
Top