The ancient laws of Supply and Demand are about how much of a stock or asset is available and how many buyers want it.
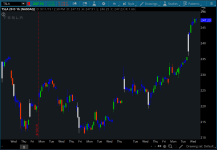
This indicator uses the ATR to define whether the price level is out of balance, indicating there might be a significant move about to happen --exciting zone. Or if they are in balance --boring zone.
Notes by the original developer:
This Script helps you identify the basing and explosive candles which can be used for Supply and Demand Analysis methodology
- Blue Candle represents the Boring Candles ==> Demand and Supply is in balance
- Black Candle (the one in ThinkorSwim is white) represents the Exciting Candles ==> imbalance between Demand and Supply
thinkScript Code
Code:
# Supply and Demand Candles
# Assembled by BenTen at useThinkScript.com
# Converted from https://www.tradingview.com/script/KRlFYBWy-Demand-and-Supply-Candles-open/

input Sensitivity = 1.5;
def Candle_Range = high - low;
def Body_Range = AbsValue(close - open);
def Bar_Lookback = 100;
def Volatility = atr(Bar_Lookback);
def Strength = Volatility * Sensitivity;
def Exciting = (Body_Range > Candle_Range* 0.6) and (Candle_Range >= Strength);
def Boring = Body_Range <= Candle_Range * 0.5;
assignPriceColor(if Exciting then Color.WHITE else if Boring then Color.Blue else Color.Current);
Attachments
Last edited by a moderator:

