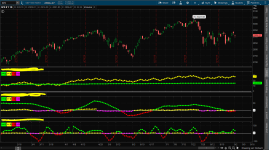
Don't try to reverse engineer what this image shows...I'll post the code/description later...
Just wondering if anyone sees a way to play this indicator?

Well, not a lot of input here, but really I wrote this because someone said there are about the same number of up days and down days in a given year. So of course I set out to measure this...who knows, maybe mean reversion or something could be some odd indicator.
As promised, here is the code for this Up Down Ratio. The plots above are year/month/week on a 1-Day chart.
Enjoy
Just wondering if anyone sees a way to play this indicator?
Well, not a lot of input here, but really I wrote this because someone said there are about the same number of up days and down days in a given year. So of course I set out to measure this...who knows, maybe mean reversion or something could be some odd indicator.
As promised, here is the code for this Up Down Ratio. The plots above are year/month/week on a 1-Day chart.
Enjoy
Code:
# Stock Market Days Up vs. Days Down Indicator for ThinkorSwim
#
# Shows number of up days versus down days.
#
# Author: Kory Gill, @korygill
#

declare lower;
declare once_per_bar;
declare hide_on_intraday;

input RollOverPeriod = {default year, month, week};

def vClose = close;
def year = GetYear();
def month = GetMonth();
def week = GetWeek();
def isRollOver;
def lookback;

switch (RollOverPeriod) {
    case year:
        isRollOver = if year != year[1] then 1 else 0;
        lookback = 252;
    case month:
        isRollOver = if month != month[1] then 1 else 0;
        lookback = 20;
    case week:
        lookback = 5;
        isRollOver = if week != week[1] then 1 else 0;
};

def bn = BarNumber();

def upCount = if bn == 1 then 0
              else if isRollOver then if vClose >= vClose[1] then 1 else 0
              else if vClose >= vClose[1] then upCount[1]+1 else upCount[1];

def dnCount = if bn == 1 then 0
              else if isRollOver then if vClose < vClose[1] then -1 else 0
              else if vClose < vClose[1] then dnCount[1]-1 else dnCount[1];

# used for debugging
#plot pUpCount = upCount;
#plot pDnCount = dnCount;
#plot pTotal = upCount - dnCount;

plot zeroLine = 0;
zeroLine.SetDefaultColor(Color.White);

def upSum = Sum(upCount, lookback);
def dnSum = Sum(dnCount, lookback);
plot pSumUpDnRatio = if dnSum != 0 then (upSum+dnSum)/(upSum-dnSum)*100 else 0;
pSumUpDnRatio.AssignValueColor(if pSumUpDnRatio >= 0 then Color.Green else Color.Red);
pSumUpDnRatio.SetPaintingStrategy(PaintingStrategy.LINE_VS_POINTS);

plot pUpVsDn = upCount + dnCount;
pUpVsDn.AssignValueColor(if pUpVsDn >= 0 then Color.Yellow else Color.Magenta);
pUpVsDn.SetPaintingStrategy(PaintingStrategy.LINE_VS_POINTS);

AddLabel(yes, ">= 0", Color.Green);
AddLabel(yes, ">= 0", Color.Yellow);
AddLabel(yes, "< 0", Color.Red);
AddLabel(yes, "< 0", Color.Magenta);
Attachments
Last edited by a moderator:

