Stock Market Days Up vs. Days Down Indicator for ThinkorSwim

korygill

Well-known member
VIP
Don't try to reverse engineer what this image shows...I'll post the code/description later...

Just wondering if anyone sees a way to play this indicator?

tlr8ksr.png


Well, not a lot of input here, but really I wrote this because someone said there are about the same number of up days and down days in a given year. So of course I set out to measure this...who knows, maybe mean reversion or something could be some odd indicator.

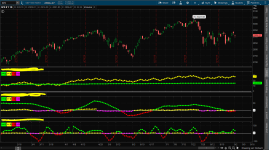
As promised, here is the code for this Up Down Ratio. The plots above are year/month/week on a 1-Day chart.

Enjoy :)

Code:
# Stock Market Days Up vs. Days Down Indicator for ThinkorSwim
#
# Shows number of up days versus down days.
#
# Author: Kory Gill, @korygill
#

declare lower;
declare once_per_bar;
declare hide_on_intraday;

input RollOverPeriod = {default year, month, week};

def vClose = close;
def year = GetYear();
def month = GetMonth();
def week = GetWeek();
def isRollOver;
def lookback;

switch (RollOverPeriod) {
    case year:
        isRollOver = if year != year[1] then 1 else 0;
        lookback = 252;
    case month:
        isRollOver = if month != month[1] then 1 else 0;
        lookback = 20;
    case week:
        lookback = 5;
        isRollOver = if week != week[1] then 1 else 0;
};

def bn = BarNumber();

def upCount = if bn == 1 then 0
              else if isRollOver then if vClose >= vClose[1] then 1 else 0
              else if vClose >= vClose[1] then upCount[1]+1 else upCount[1];

def dnCount = if bn == 1 then 0
              else if isRollOver then if vClose < vClose[1] then -1 else 0
              else if vClose < vClose[1] then dnCount[1]-1 else dnCount[1];

# used for debugging
#plot pUpCount = upCount;
#plot pDnCount = dnCount;
#plot pTotal = upCount - dnCount;

plot zeroLine = 0;
zeroLine.SetDefaultColor(Color.White);

def upSum = Sum(upCount, lookback);
def dnSum = Sum(dnCount, lookback);
plot pSumUpDnRatio = if dnSum != 0 then (upSum+dnSum)/(upSum-dnSum)*100 else 0;
pSumUpDnRatio.AssignValueColor(if pSumUpDnRatio >= 0 then Color.Green else Color.Red);
pSumUpDnRatio.SetPaintingStrategy(PaintingStrategy.LINE_VS_POINTS);

plot pUpVsDn = upCount + dnCount;
pUpVsDn.AssignValueColor(if pUpVsDn >= 0 then Color.Yellow else Color.Magenta);
pUpVsDn.SetPaintingStrategy(PaintingStrategy.LINE_VS_POINTS);

AddLabel(yes, ">= 0", Color.Green);
AddLabel(yes, ">= 0", Color.Yellow);
AddLabel(yes, "< 0", Color.Red);
AddLabel(yes, "< 0", Color.Magenta);
 

Attachments

  • tlr8ksr.png
    tlr8ksr.png
    129.3 KB · Views: 163
Last edited by a moderator:
Well the obvious setup is 0 line cross on fastest momentum(bottom) when in confluence with slower momentum (mid).
 
As a side note, I used to track number of down days and if we go to around 8-9 down days on the XAU, you could do a pretty low risk trade the next day was up. If it was not, double down. If not again, double down again. Kind of like the ultimate winning roulette strategy if you had infinite funds. /lol That said, there are better ways to play XAU then counting down days, but events outside the norm do mean revert, so it's not all that crazy. Check out my posts on FGMR for a working example of this in action.
 
Hi TOS experts,

I am trying to write a script that selects stocks that have 3 consecutive days of rising prices and with rising volume, once they cross SMA 20 for a specific market cap.

I have the preset market cap and SMA filters in the scanner.

How do i capture current close, previous-day close and previous-day-1 closing price and compare; and repeat the same for volume.
 

Join useThinkScript to post your question to a community of 21,000+ developers and traders.

Similar threads

Not the exact question you're looking for?

Start a new thread and receive assistance from our community.

87k+ Posts
543 Online
Create Post

Similar threads

Similar threads

The Market Trading Game Changer

Join 2,500+ subscribers inside the useThinkScript VIP Membership Club
  • Exclusive indicators
  • Proven strategies & setups
  • Private Discord community
  • ‘Buy The Dip’ signal alerts
  • Exclusive members-only content
  • Add-ons and resources
  • 1 full year of unlimited support

Frequently Asked Questions

What is useThinkScript?

useThinkScript is the #1 community of stock market investors using indicators and other tools to power their trading strategies. Traders of all skill levels use our forums to learn about scripting and indicators, help each other, and discover new ways to gain an edge in the markets.

How do I get started?

We get it. Our forum can be intimidating, if not overwhelming. With thousands of topics, tens of thousands of posts, our community has created an incredibly deep knowledge base for stock traders. No one can ever exhaust every resource provided on our site.

If you are new, or just looking for guidance, here are some helpful links to get you started.

What are the benefits of VIP Membership?
VIP members get exclusive access to these proven and tested premium indicators: Buy the Dip, Advanced Market Moves 2.0, Take Profit, and Volatility Trading Range. In addition, VIP members get access to over 50 VIP-only custom indicators, add-ons, and strategies, private VIP-only forums, private Discord channel to discuss trades and strategies in real-time, customer support, trade alerts, and much more. Learn all about VIP membership here.
How can I access the premium indicators?
To access the premium indicators, which are plug and play ready, sign up for VIP membership here.
Back
Top