Squeeze & Release [Algo Alert] for ThinkOrSwim

samer800

Moderator - Expert
VIP
Lifetime
CZtxhuE.png

Author Message:
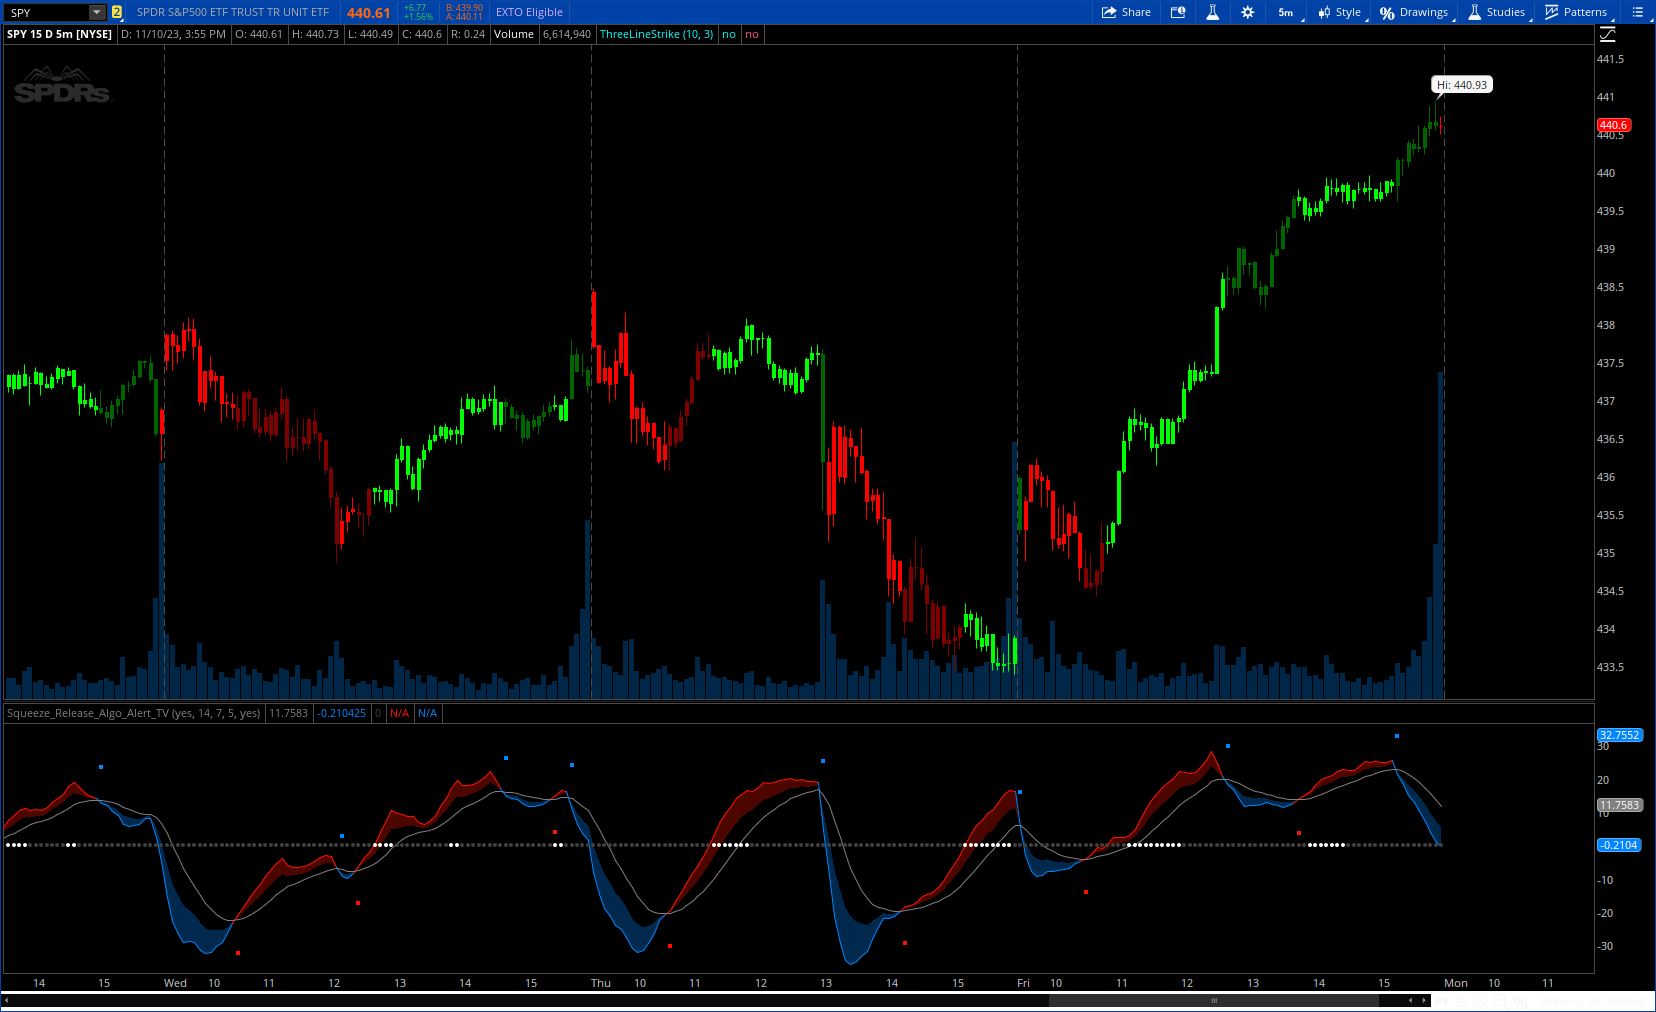
The Squeeze & Release by Algo Alert is an innovative tool designed to capture price volatility dynamics using a combination of EMA-based calculations and ATR principles. This script aims to provide traders with clear visual cues to spot potential market squeezes and release scenarios.
More details: https://www.tradingview.com/v/2GQIc9Ms/

CODE:

CSS:
#// This source code is subject to the terms of the Mozilla Public License 2.0
#// © Algo_Alert
#indicator(title="Squeeze & Release [Algo Alert]", shorttitle="?&? [Algo Alert]", overlay=false, timeframe="",
# Converted by Sam4Cok@Samer800    - 11/2023
declare lower;

input colorBars = yes;
input CalculationPeriod = 14;     # "Calculation Period"
input SmoothingLength = 7;        # "Smoothing Length"
input HyperSqueezeDetectionLength = 5;    # "Hyper Squeeze Detection Length"
input applySmoothing = yes;

def na = Double.NaN;
def last = IsNaN(close);
DefineGlobalColor("green", CreateColor(0, 135, 255));# "Release Color"
DefineGlobalColor("red", CreateColor(255, 17, 0));# "Squeeze Color"

script rising{
    input src = close;
    input len = 3;
    def cnt = fold i = 0 to len with p do
              if src[i] > GetValue(src, i + 1) then p + 1 else p;
    plot out = cnt == len;
}
def HiLo = high - low;
def tr = TrueRange(high, close, low);
def a = ExpAverage(tr, CalculationPeriod);
def ama = ExpAverage(a, CalculationPeriod * 2);
def v = ama - a;
def difEMA = ExpAverage(HiLo, CalculationPeriod * 2);
def svRegular = v / difEMA * 100;
def svSmooth = ExpAverage(svRegular, SmoothingLength);
def sv_ = if applySmoothing then svSmooth else svRegular;
def sv = sv_;
def svma = ExpAverage(sv, CalculationPeriod);
def crossUp = Crosses(sv, svma, CrossingDirection.ABOVE);
def crossDn = Crosses(sv, svma, CrossingDirection.BELOW);
def raise = sv > 0 and rising(sv, HyperSqueezeDetectionLength);
#== PLot
plot ma = svma;
ma.SetDefaultColor(Color.GRAY);
plot val = sv;    # "ATR"
val.AssignValueColor(if sv > svma then GlobalColor("red") else GlobalColor("green"));
plot mid = if last then na else 0;
mid.SetPaintingStrategy(PaintingStrategy.POINTS);
mid.AssignValueColor(if raise then Color.WHITE else Color.DARK_GRAY);

plot SigUp = if crossUp then svma - 10 else na;#, "Squeeze"
plot SigDn = if crossDn then svma + 10 else na;#, "Release"
SigUp.SetPaintingStrategy(PaintingStrategy.SQUARES);
SigDn.SetPaintingStrategy(PaintingStrategy.SQUARES);
SigUp.SetDefaultColor(GlobalColor("red"));
SigDn.SetDefaultColor(GlobalColor("green"));

def fillcol = ma + (val - ma)/2;

AddCloud(val, fillcol, GlobalColor("red"), GlobalColor("green"));

#-- Bar Color

def col = if sv > 0 then
          if sv > svma then 2 else 1 else
          if sv < 0 then
          if sv < svma then -2 else -1 else 0;

AssignPriceColor(if !colorBars then Color.CURRENT else
                 if col==2 then Color.GREEN else
                 if col==1 then Color.DARK_GREEN else
                 if col==-2 then Color.RED else
                 if col==-1 then Color.DARK_RED else Color.GRAY);
#-- END of CODE
 

Join useThinkScript to post your question to a community of 21,000+ developers and traders.

Would mind discussing how you use/interpret the indicator that you created?

Per the OP on Tradingview
https://www.tradingview.com/script/2GQIc9Ms-Squeeze-Release-Algo-Alert/

Volatility
Average True Range (ATR) is a core component of the script. The differential between the smoothed ATR and its EMA is used to plot the main line. This differential, when represented as a percentage of the high-low range, provides insights into volatility.

Members use this to fine-tune their entries and exits.

Squeeze/Release
Squeeze and Release Detection: The script identifies and highlights squeeze and release scenarios based on the crossover and crossunder events between our main line and its smoothed version. Squeezes are potential setups where the market may be consolidating, and releases indicate a potential breakout or breakdown.
Hyper Squeeze Detection: A unique feature that detects instances when the main line is rising consistently over a user-defined period. Hyper squeeze marks areas of extremely low volatility.

Members use this to Identify potential consolidation (squeeze) zones and gauge potential breakout or breakdown scenarios (release).
 
Is there any way to get this code to show squeeze dots on mobile? I think it has to do with the three lines starting at line 44 here; but i just couldn't get it figured out on my own.. its an interesting indicator, i thought maybe adding MTF functionality could be useful too.

plot mid = if last then na else 0;
mid.SetPaintingStrategy(PaintingStrategy.POINTS);
mid.AssignValueColor(if raise then Color.WHITE else Color.DARK_GRAY);
 

Similar threads

Not the exact question you're looking for?

Start a new thread and receive assistance from our community.

87k+ Posts
455 Online
Create Post

Similar threads

Similar threads

The Market Trading Game Changer

Join 2,500+ subscribers inside the useThinkScript VIP Membership Club
  • Exclusive indicators
  • Proven strategies & setups
  • Private Discord community
  • ‘Buy The Dip’ signal alerts
  • Exclusive members-only content
  • Add-ons and resources
  • 1 full year of unlimited support

Frequently Asked Questions

What is useThinkScript?

useThinkScript is the #1 community of stock market investors using indicators and other tools to power their trading strategies. Traders of all skill levels use our forums to learn about scripting and indicators, help each other, and discover new ways to gain an edge in the markets.

How do I get started?

We get it. Our forum can be intimidating, if not overwhelming. With thousands of topics, tens of thousands of posts, our community has created an incredibly deep knowledge base for stock traders. No one can ever exhaust every resource provided on our site.

If you are new, or just looking for guidance, here are some helpful links to get you started.

What are the benefits of VIP Membership?
VIP members get exclusive access to these proven and tested premium indicators: Buy the Dip, Advanced Market Moves 2.0, Take Profit, and Volatility Trading Range. In addition, VIP members get access to over 50 VIP-only custom indicators, add-ons, and strategies, private VIP-only forums, private Discord channel to discuss trades and strategies in real-time, customer support, trade alerts, and much more. Learn all about VIP membership here.
How can I access the premium indicators?
To access the premium indicators, which are plug and play ready, sign up for VIP membership here.
Back
Top