
Author Message :
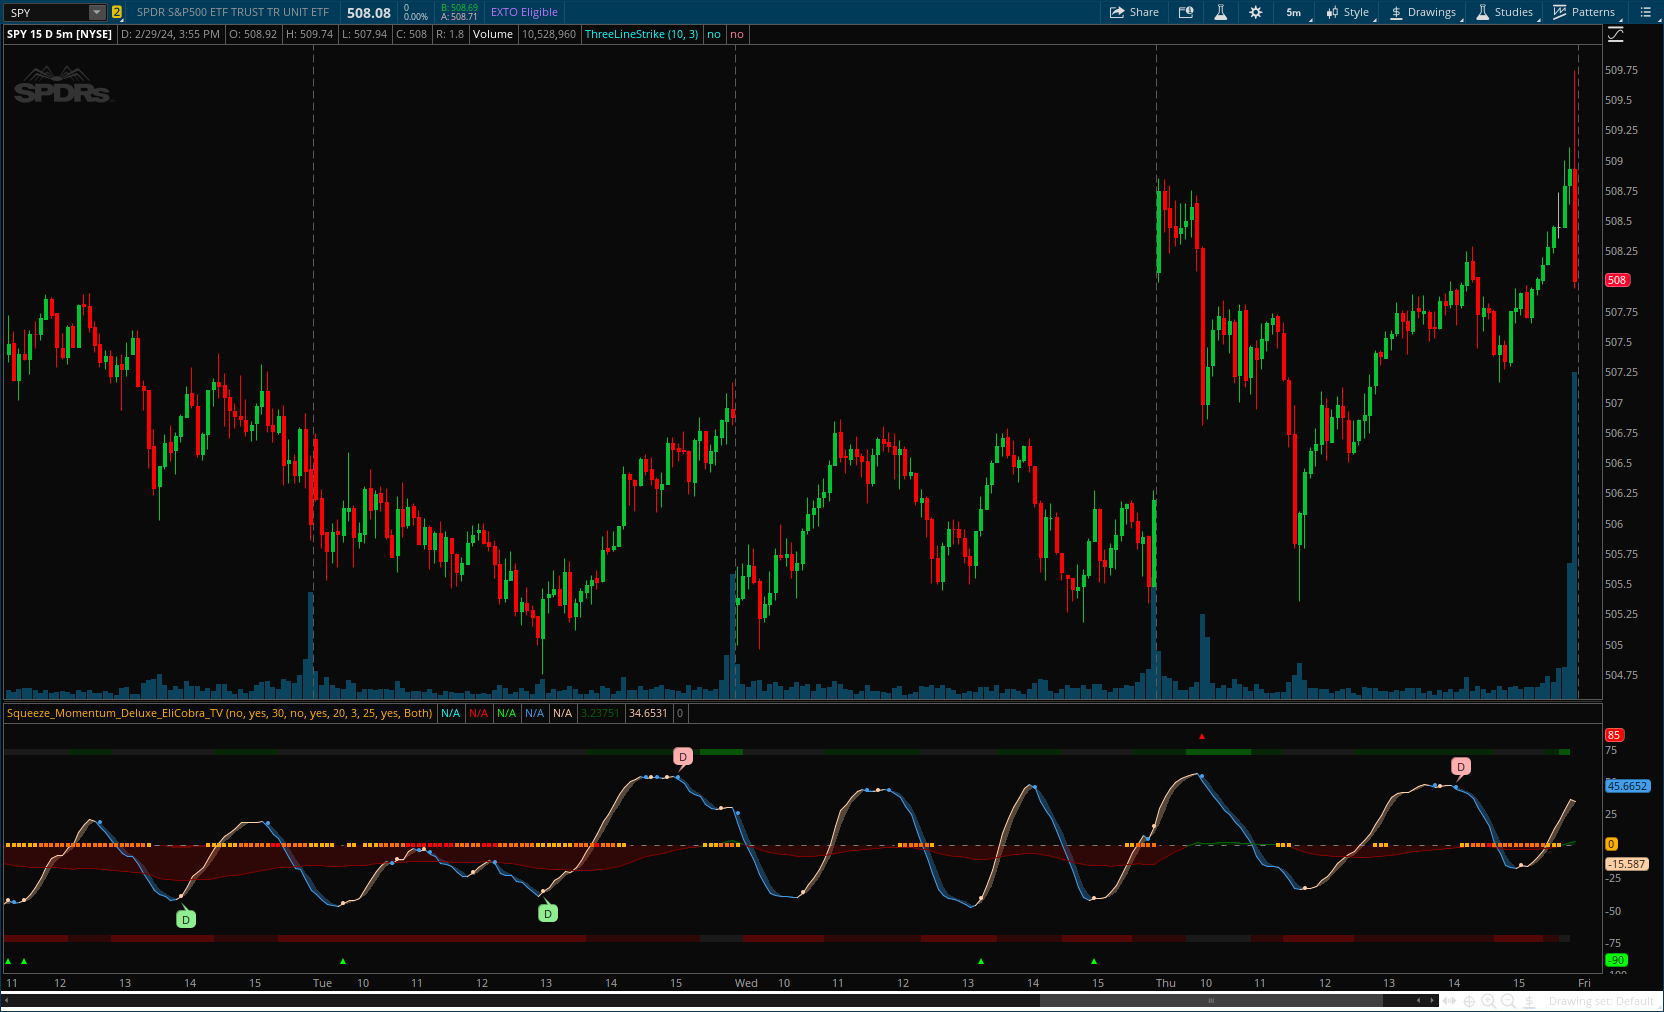
The Squeeze Momentum Deluxe is a comprehensive trading toolkit built with features of momentum, volatility, and price action. This script offers a suite for both mean reversion and trend-following analysis. Developed based on the original TTM Squeeze implementation by @LazyBear, this indicator introduces several innovative components to enhance your trading insights.
Read more: https://www.tradingview.com/v/iFZB4wBg/
CODE:
CSS:
# https://www.tradingview.com/v/iFZB4wBg/
#// This Pine Script™ code is subject to the terms of the Attribution-NonCommercial-ShareAlike
#// © EliCobra
#indicator("Squeeze Momentum Deluxe", "[?] -? Squeeze Deluxe", false, explicit_plot_zorder = true,
# Converted by Sam4Cok@Samer800    - 03/2024
declare lower;

input colorBars = no;
input showDirectionalFlux = yes;
input DirectionalFluxLength = 30; #    , "Length???"
input TrendBias = no; #  (false , "Trend Bias"
input showSqueezeMomentum = yes;
input SqueezeMomentumLength = 20; #    , "Length???"
input signalLength = 3; #     , "Signal???????"
input DivergenceSensitivity = 25; #    , "Sensitivity???"
input showDivergenceLabels = yes; #  (true  , "Labels"
input showGauges = {default "Both", "Bull", "Bear", "None"}; #"Showcase?????"

def na = Double.NaN;
def last = IsNaN(close);
DefineGlobalColor("sqzH", Color.RED);
DefineGlobalColor("sqzM", CreateColor(255, 110, 0));
DefineGlobalColor("sqzL", CreateColor(255, 175, 0));
DefineGlobalColor("cup", CreateColor(255, 207, 166));
DefineGlobalColor("cdn", CreateColor(65, 159, 236));

script osc {
    input sig = 3;
    input len = 20;
    def av = Average(hl2, len);
    def zHi = Highest(high, len);
    def zLo = Lowest (low, len);
    def zHL = (zHi + zLo) / 2;
    def zTR = TrueRange(zHi, close, zLo);
    def zATR = WildersAverage(zTR, 1);
    def avTR = (zHL + av) / 2;
    def avgSrc = (close - avTR) / zATR * 100;
    def linRegX  = Inertia(avgSrc, len);
    def smoothX = Average(linRegX, sig);
    plot linReg = linRegX;
    plot smooth = smoothX;
}
script dfo {
    input cl = close;
    input hi = high;
    input lo = low;
    input len = 20;
    def trSrc = TrueRange(hi, cl, lo);
    def tr = WildersAverage(trSrc, len);
    def up = WildersAverage(Max((hi - hi[1]), 0), len) / (tr);
    def dn = WildersAverage(Max((lo - lo[1]) * -1, 0), len) / (tr);
    def nRSI = (up - dn) / (up + dn);
    def x  = WildersAverage (nRSI, Floor(len / 2)) * 100;
    plot o = x;
    plot s = if x > +25 then (x -  25) else
             if x < -25 then (x +  25) else Double.NaN;
}
script sqz {
    input len = 20;
    def tr = TrueRange(high, close, low);
    def dev = StDev(close, len);
    def atr = if len <=1 then tr else ATR(Length = len);
    def sqz1 = dev < (atr * 0.25 * 2);
    def sqz2 = dev < (atr * 0.25 * 3);
    def sqz3 = dev < (atr * 0.25 * 4);
    plot sqzH = sqz1;
    plot sqzM = sqz2;
    plot sqzL = sqz3;
}
script draw {
    input oo = high;
    input os = low;
    input trs = 25;
    def bi = BarNumber();
    def bh = high;
    def bl = low;
    def u = (oo < os) and (oo[1] >= os[1]);
    def l = (oo > os) and (oo[1] <= os[1]);
    def x = os;
    def dp;
    def ds;
    def p;
    if oo > trs and u and !IsNaN(close[-1]) {
        if isNaN(dp[1]) or dp[1]==0 {
            dp = bh;
            ds = x;
            p = no;
        } else {
            if bh > dp[1] and x < ds[1] {
                dp = dp[1];
                ds = ds[1];
                p =  yes;
            }  else {
                dp = bh;
                ds = x;
                p =  no;
            }
        }
    } else if oo < -trs and l and !IsNaN(close[-1]) {
        if isNaN(dp[1]) or dp[1]==0 {
            dp = bl;
            ds = x;
            p = no;
        } else {
            if bl < dp[1] and x > ds[1] {
                dp = dp[1];
                ds = ds[1];
                p =  yes;
            }  else {
                dp = bl;
                ds = x;
                p =  no;
            }
        }
    } else {
        dp = dp[1];
        ds = ds[1];
        p = no;
    }
    plot out = if IsNaN(p) then no else p;
}

def hac = (open + high + low + close) / 4;
def hao = CompoundValue(1,  (hao[1] + hac[1]) / 2, (open + close) / 2);
def hah = Max(high, Max(hao, hac));
def hal = Min(low, Min(hao, hac));
def HiSrc = if TrendBias then hah else high;
def LoSrc = if TrendBias then hal else low;
def ClSrc = if TrendBias then hac else close;

def sh = sqz(SqueezeMomentumLength).sqzH;
def sm = sqz(SqueezeMomentumLength).sqzM;
def sl = sqz(SqueezeMomentumLength).sqzL;
def colsq = if sh then 1 else if sm then 2 else 3;

plot sq = if sl then  0 else na;
sq.SetPaintingStrategy(PaintingStrategy.SQUARES);
sq.AssignValueColor(if colsq == 1 then GlobalColor("sqzH") else
                    if colsq == 2 then GlobalColor("sqzM") else GlobalColor("sqzL"));

def oo = osc(signalLength, SqueezeMomentumLength).linReg;
def os = osc(signalLength, SqueezeMomentumLength).smooth;
def vo = dfo(ClSrc, HiSrc, LoSrc, DirectionalFluxLength).o;
def vs = dfo(ClSrc, HiSrc, LoSrc, DirectionalFluxLength).s;

def uu = 75;
def ul = 70;
def uc = if (vo > 0 and oo > 0) then 2 else if (vo > 0 or  oo > 0) then 1 else 0;
def up = showGauges == showGauges."Both" or  showGauges == showGauges."Bull";
def du = -70;
def dl = -75;
def dc = if (vo < 0 and oo < 0) then -2 else if (vo < 0 or  oo < 0) then -1 else 0;
def dp = showGauges == showGauges."Both" or  showGauges == showGauges."Bear";
def OverFlux = if showDirectionalFlux then vs else na;#, "OverFlux"
def p = draw(oo, os, DivergenceSensitivity);
def ab = (oo crosses above os) and oo < -40 and vo < 0;
def as = (oo crosses below os) and oo > +40 and vo > 0;
def au = (oo crosses above 0);
def ad = (oo crosses below 0);
def ap = (vo crosses above 0);
def an = (vo crosses below 0);
def ax = (oo crosses below os) and showSqueezeMomentum;
def ay = (oo crosses above os) and showSqueezeMomentum;
def NOuc = uc == 0;
def NOdc = dc == 0;
def aa = (NOuc - NOuc[1]) and uc == 1;
def ac = (NOdc - NOdc[1]) and dc == -1;
def aq = (NOuc - NOuc[1]) and uc == 2;
def aw = (NOdc - NOdc[1]) and dc == -2;
def ah = (sh - sh[1]) and sh;
def am = (sm - sm[1]) and sm;
def al = (sl - sl[1]) and sl;
def ae = p and oo >  DivergenceSensitivity;
def af = p and oo < -DivergenceSensitivity;
def BearishDiv = if (showDivergenceLabels and ae) then os + 3 else na; #, "Bearish Divergence"
def BullishDiv = if (showDivergenceLabels and af) then os - 3 else na; #, "Bullish Divergence"

plot ConfluenceSell = if (up and as) then uu + 10 else na; # "Confluence Sell"
plot ConfluenceBuy  = if (dp and ab) then dl - 15 else na; #, "Confluence Buy "

ConfluenceSell.SetPaintingStrategy(PaintingStrategy.TRIANGLES);
ConfluenceBuy.SetPaintingStrategy(PaintingStrategy.TRIANGLES);
ConfluenceBuy.SetDefaultColor(Color.GREEN);
ConfluenceSell.SetDefaultColor(Color.RED);

plot TrendShiftDn = if ax then os else na; #, "Trend Shift"
plot TrendShiftUp = if ay then oo else na; #, "Trend Shift"
TrendShiftDn.SetDefaultColor(GlobalColor("cdn"));
TrendShiftUp.SetDefaultColor(GlobalColor("cup"));
TrendShiftDn.SetPaintingStrategy(PaintingStrategy.POINTS);
TrendShiftUp.SetPaintingStrategy(PaintingStrategy.POINTS);

plot Flux  = if showDirectionalFlux then vo else na; #, "Flux"
plot Mom  = if showSqueezeMomentum then oo  else na;

Flux.AssignValueColor(if Flux > 0 then Color.DARK_GREEN else Color.DARK_RED);
Mom.AssignValueColor(if oo > os then GlobalColor("cup") else GlobalColor("cdn"));

AddCloud(Mom, os, GlobalColor("cup"), GlobalColor("cdn"));
AddCloud(Flux,  0,  Color.DARK_GREEN,  Color.DARK_RED);
AddCloud(OverFlux,  0, Color.GREEN, Color.RED);


plot zero = if last or sl then na else 0;
zero.SetStyle(Curve.SHORT_DASH);
zero.SetDefaultColor(Color.GRAY);

def ll = if !last and dp then dl else na; #, "Lower Gauge"
def hl = if !last and dp then du else na; #, "Lower Gauge"
def hh = if !last and up then uu else na; #, "Upper Gauge"
def lh = if !last and up then ul else na; #, "Upper Gauge"


AddCloud(if uc > 1 or uc[-1] > 1 then hh else na, lh, Color.GREEN);
AddCloud(if uc == 1 or uc[-1] == 1 then hh else na, lh, Color.DARK_GREEN);
AddCloud(if uc < 1 or uc[-1] < 1 then hh else na, lh, Color.DARK_GRAY);

AddCloud(if dc < -1 or dc[-1] < -1 then hl else na, ll, Color.RED);
AddCloud(if dc == -1 or dc[-1] == -1 then hl else na, ll, Color.DARK_RED);
AddCloud(if dc > -1 or dc[-1] > -1 then hl else na, ll, Color.DARK_GRAY);

AddChartBubble(BearishDiv, BearishDiv, "D", Color.PINK);
AddChartBubble(BullishDiv, BullishDiv, "D", Color.LIGHT_GREEN, no);

AssignPriceColor(if !colorBars then Color.CURRENT else
                 if uc == 2 then Color.GREEN else
                 if dc ==-2 then Color.RED else
                 if uc == 1 then Color.DARK_GREEN else
                 if dc ==-1 then Color.DARK_RED else Color.GRAY);
# End of code