
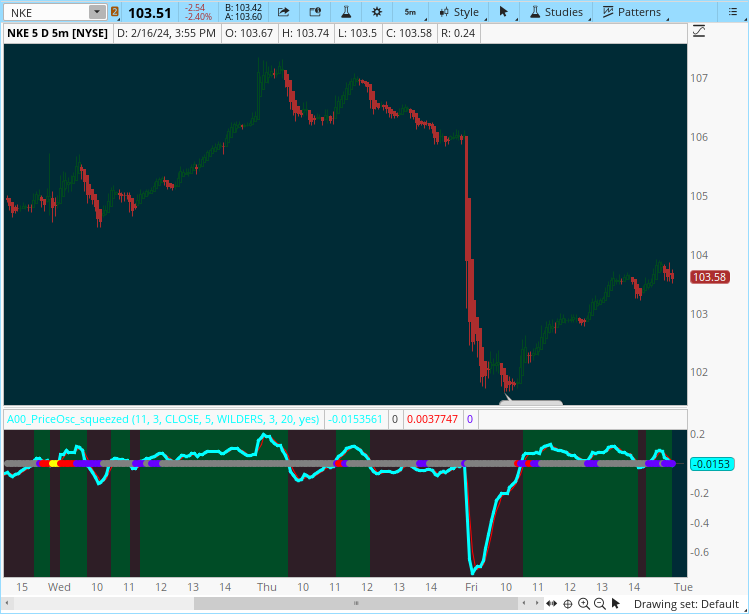
Here is the PriceOsc. I am using these settings is because it seems to mimic John Carter’s “Trend Rotation” indicator (not his higher time frame ones that clutter his charts).
He has said that he has three different ones based on the:
1. MACDTwoLines;
2. Squeeze Histogram;
3. and Secret Sauce?
He also uses multiple time frames on just one chart. I looked at various possibilities, but decided that (for me) simple was much better and I settled on 1-minute, 3-minute and 5-minute charts (to day trade) along with a single period PriceOsc on each chart (with these settings) substituting for John Carter’s Trend Rotation Tool …
since I was not going to buy his indicator and I have no idea what his actual setting are. John Carter’s higher time frames seem to lag too much for my style of trading, so I just use this one. With the lower panel multi-color change background from SleepyZ, it makes the crossovers easier to spot quickly and with just a glance.
mod note:
Also see @csricksdds version here:
https://usethinkscript.com/threads/priceosc-squeeze-for-thinkorswim.17995/#post-138405
@SleepyZ,
RESPECT!!!
THANK YOU for showing us how to change the background color of a single lower panel on a TOS chart. I often thought about it, but I did not think it was even possible to do. Wow … this has really opened up some possibilities!
Make any modifications that you think would help. Good trading!
Ruby:
# PriceOsc_wBackgroundColor_wSqueezePro

declare lower;
input colorNormLength = 11;
input fastLength = 3;
input price = close;
input slowLength = 5;
input averageType = AverageType.WILDERS;
input MALength = 3;
plot PriceOsc = MovingAverage(averageType, price, fastLength) - MovingAverage(averageType, price, slowLength);
plot ZeroLine = 0;
plot MA = Average(PriceOsc, MALength);
PriceOsc.SetDefaultColor(Color.CYAN);
PriceOsc.SetLineWeight(3);
ZeroLine.SetDefaultColor(Color.DARK_GRAY);
MA.SetDefaultColor(Color.RED);

input length = 20;
#Keltner Channels
def hb = 1.0;
def mb = 1.5;
def lb = 2.0;
def avg = Average(close, length);
def k1 = avg + (hb * Average(TrueRange(high, close, low), length));
def k2 = avg + (mb * Average(TrueRange(high, close, low), length));
def k3 = avg + (lb * Average(TrueRange(high, close, low), length));
#Bollinger Bands
def BB_offset = 2.0;
def sDev = stdev(close, length);
def mid = Average(close, length);
def bb = mid + BB_offset * sDev;
#Squeeze
def s0 = bb > k3;
def s1 = bb < k1;
def s2 = bb < k2;
def s3 = bb < k3;
plot squeeze = if s0 or s1 or s2 or s3 then 0 else double.nan;
squeeze.SetLineWeight(4);
squeeze.SetStyle(curve.POINTS);
squeeze.AssignValueColor(if s1 then CreateColor(255, 255, 0)
else if s2 then CreateColor(255, 0, 0)
else if s3 then CreateColor(102, 0, 255)
else CreateColor(128, 128, 128));

DefineGlobalColor("Positive", CreateColor(0, 153, 0));
DefineGlobalColor("Negative", CreateColor(153, 0, 0));

input colorBackground = yes;
def xcolor=if PriceOsc > 0 then 1 else 0;
addcloud(if !colorBackground then double.nan
else if xcolor==1
then double.POSITIVE_INFINITY
else double.NEGATIVE_INFINITY,
if xcolor==1
then double.NEGATIVE_INFINITY
else double.POSITIVE_INFINITY,
globalColor("Positive"), globalcolor("Negative"));
Last edited by a moderator: