Spinning Tops Candlestick Pattern for ThinkorSwim

BenTen

Administrative
Staff member
Staff
VIP
Lifetime
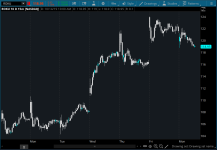
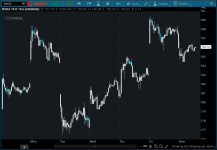
Spinning top is a candlestick pattern that shows indecision in the market.

It’s a small candlestick pattern. In this pattern, the stock prices open and close are near each other. This pattern forms when there’s indecision among the buyers and sellers in the uptrend, downtrend, or sideways trend. The pattern suggests a possible change in trend.

0L79ppt.png

czmI3SQ.png


thinkScript Code

Code:
# Spinning Top Candlestick Pattern
# Assembled by BenTen at useThinkScript.com
# Converted from https://www.tradingview.com/script/LyNzdJVX-Spinning-Tops/

input stsize = 0.5;
def spinningtop = (open>close) and ((high-low)>(3*(open-close))and(((high-open)/(.001+high-low))< stsize)and (((close-low)/(.001+high-low))< stsize)) or (close>open) and ((high-low)>(3*(close-open))and(((high-close)/(.001+high-low))< stsize)and (((open-low)/(.001+high-low))< stsize));

assignPriceColor(if spinningtop then Color.CYAN else Color.WHITE);

A few resources to help you learn more about this pattern:
 

Attachments

  • 0L79ppt.png
    0L79ppt.png
    69.4 KB · Views: 107
  • czmI3SQ.png
    czmI3SQ.png
    74.6 KB · Views: 98

Join useThinkScript to post your question to a community of 21,000+ developers and traders.

Hi I'm new! This seems to work very well on oil futures, 5mins. Due to me being partial colour blind, I can't spot colours that well, hence using a white background, with black and hollow candles. Is it possible to change the code "then Color.BLUE else Color.[no change]);
I'm unsure how to change this variable.

Edit: silly me. all i have to do is change color to black, since the up candles are hollow
 
Last edited:
@Playstation Here you go:

Code:
# Plot Signal
plot signal = spinningtop;
signal.SetPaintingStrategy(PaintingStrategy.BOOLEAN_ARROW_UP);
signal.SetDefaultColor(Color.CYAN);
signal.SetLineWeight(1);

The arrow isn't to give you direction, it's just telling you where the spinning top is.
 
@BenTen I saw an indicator on TView where the “body” of the Spinning Top candle is displayed a S/R line. I can probably cut and paste a code but cannot find a code that does that. I’ve only found S/R lines that display High/Low/Middle. Thanks for the guidance.
 
@MHCain Take a look at the "fancy version" of the Blast Off indicator here and use part of its script for this one.
 
I usually refactor the code to get a better understanding of what it's doing. Here's what I got from this:

Code:
def body_top = Max(open, close);
def body_bottom = Min(open, close);
def upper_shadow = high - body_top;
def lower_shadow = body_bottom - low;
def candle_height = high - low;

def body_height_is_less_than_one_third_candle_height = candle_height > 3 * BodyHeight();
def upper_shadow_height_is_less_than_one_half_ish_candle_height = upper_shadow < (.001 + candle_height) / 2;
def lower_shadow_height_is_less_than_one_half_ish_candle_height = lower_shadow < (.001 + candle_height) / 2;

plot spinning_top = body_height_is_less_than_one_third_candle_height
    and upper_shadow_height_is_less_than_one_half_ish_candle_height
    and lower_shadow_height_is_less_than_one_half_ish_candle_height;

assignPriceColor(if spinning_top then Color.RED else Color.WHITE);


It appears to find some spinning tops, but according to Steve Nison, linking whether it is a spinning top to the heights of the shadows like this is going to leave a lot of stuff out. Make your decisions on what sources you trust and understand that not every source agrees.
“The Japanese term for a small real body (black or white) is a spinning top. Exhibit 3.6 shows examples of spinning tops. The lines illustrated in Exhibit 3.6 have upper and lower shadows, but the sizes of the shadows are not important. It is the small size of the real body that makes these spinning tops.”

Excerpt From: Steve Nison. “Japanese Candlestick Charting Techniques.” Apple Books. https://books.apple.com/us/book/japanese-candlestick-charting-techniques/id648523437
 
Here's an alternative, attempting to just go by body size, relative to the average body size of the past 20 bars, adjustable of course. This is assuming that relatively small is when you start approaching a standard deviation less than the average. I use .5 standard deviation as a starting point since it still seems to be fairly small.

Code:
input scaling_factor= 0.5;
input length = 20;

def average_body_height = Average(BodyHeight(),length);
def body_height_std_dev = StDev(BodyHeight(),length);
def small_body = BodyHeight() < average_body_height - scaling_factor *  body_height_std_dev;

plot spinning_top = small_body;

assignPriceColor(if spinning_top then Color.RED else Color.WHITE);
 
# Study Name: Spinning_Top
# Mobius
# Note: This is a chart study. Use the provided name.
# Copy and paste the following lines of code for the appropriate scan.
# To scan for Bearish setup the scan is: Spinning_Top().Bearish is True
# To scan for Bullish setup the scan is: Spinning_Top().Bullish is TRUE

input length = 20;
input trendSetup = 2;
input shadowFactor = 0.75;

assert(shadowFactor >= 0, "'shadow factor' must not be negative: " + shadowFactor);
def ShadowHeight = shadowFactor * Average(BodyHeight(), length);
def IsLongShadows = high - Max(open, close) > ShadowHeight and
Min(open, close) - low > ShadowHeight;
def IsDoji = IsDoji(length, bodyFactor = 0.5);
plot Bearish = IsAscending(MidBodyVal(), trendSetup)[1] and
IsDoji and
IsLongShadows;

plot Bullish = IsDescending(MidBodyVal(), trendSetup)[1] and
IsDoji and
IsLongShadows;
Bearish.SetPaintingStrategy(PaintingStrategy.BOOLEAN_ARROW_DOWN);
Bearish.SetDefaultColor(GetColor(7));
Bearish.SetLineWeight(3);
Bullish.SetPaintingStrategy(PaintingStrategy.BOOLEAN_ARROW_UP);
Bullish.SetDefaultColor(GetColor(8));
Bullish.SetLineWeight(3);
# End Code
 
Hey. I am a TOS user and unfortunately there are no patterns for spinning tops. I am hoping to catch bearish or bullish spinning tops on the 3min or 5min to catch pop and fades or reversals. Thank you!

a scan for this is what i am asking sorry for not being detailed
 
Hey. I am a TOS user and unfortunately there are no patterns for spinning tops. I am hoping to catch bearish or bullish spinning tops on the 3min or 5min to catch pop and fades or reversals. Thank you!

a scan for this is what i am asking sorry for not being detailed
Your post was moved to this thread. Read through it as there are a couple variations.
 
@BenTen Thanks so much for the spinning top script. Favors, could you just code the ones that are bearish? And also take away coloring of all other candles white and leave them red and green? The arrow alert is amazing as well. Thanks again!
 
@BenTen Thanks so much for the spinning top script. Favors, could you just code the ones that are bearish? And also take away coloring of all other candles white and leave them red and green? The arrow alert is amazing as well. Thanks again!

This is a single pattern.

It occurs frequently at the beginning or end of trends.

Your job is to recognize and identify when the current trend is losing momentum and ready for a reversal.
 

Similar threads

Not the exact question you're looking for?

Start a new thread and receive assistance from our community.

87k+ Posts
490 Online
Create Post

Similar threads

Similar threads

The Market Trading Game Changer

Join 2,500+ subscribers inside the useThinkScript VIP Membership Club
  • Exclusive indicators
  • Proven strategies & setups
  • Private Discord community
  • ‘Buy The Dip’ signal alerts
  • Exclusive members-only content
  • Add-ons and resources
  • 1 full year of unlimited support

Frequently Asked Questions

What is useThinkScript?

useThinkScript is the #1 community of stock market investors using indicators and other tools to power their trading strategies. Traders of all skill levels use our forums to learn about scripting and indicators, help each other, and discover new ways to gain an edge in the markets.

How do I get started?

We get it. Our forum can be intimidating, if not overwhelming. With thousands of topics, tens of thousands of posts, our community has created an incredibly deep knowledge base for stock traders. No one can ever exhaust every resource provided on our site.

If you are new, or just looking for guidance, here are some helpful links to get you started.

What are the benefits of VIP Membership?
VIP members get exclusive access to these proven and tested premium indicators: Buy the Dip, Advanced Market Moves 2.0, Take Profit, and Volatility Trading Range. In addition, VIP members get access to over 50 VIP-only custom indicators, add-ons, and strategies, private VIP-only forums, private Discord channel to discuss trades and strategies in real-time, customer support, trade alerts, and much more. Learn all about VIP membership here.
How can I access the premium indicators?
To access the premium indicators, which are plug and play ready, sign up for VIP membership here.
Back
Top