@HighBredCloud For your review:
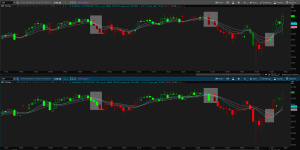
A "Rough" Simple Moving Average Slimmer Ribbon:

A "Smoothed" Simple Moving Average Slimmer Ribbon:

A "Rough" Hull Moving Average Slimmer Ribbon:

A "Smoothed" Hull Moving Average Slimmer Ribbon:

A "Rough" Simple Moving Average Slimmer Ribbon:
A "Smoothed" Simple Moving Average Slimmer Ribbon:
A "Rough" Hull Moving Average Slimmer Ribbon:
A "Smoothed" Hull Moving Average Slimmer Ribbon:
Code:
# filename: MR__EZ_Slimmer_Ribbon_
# source: https://usethinkscript.com/threads/slim-ribbon-indicator-for-thinkorswim.245/
# original authors: Slim Miller and @markos
# idea source: @HighBredCloud
# enhancements: @netarchitech

#V01.01.11.20.2019

input price = close;
input SlimmerMALength1 = 8;
input SLimmerMALength2 = 13;
input SlimmerMALength3 = 21;
input SlimmerMAType = AverageType.EXPONENTIAL;

# plot and smooth the Moving Averages
def SlimmerMA1 = MovingAverage(SlimmerMAType, price, SlimmerMALength1);
plot SlimmerMovAvg1 = SlimmerMA1;
SlimmerMovAvg1.SetDefaultColor(Color.GREEN);
SlimmerMovAvg1.SetLineWeight(2);
SlimmerMovAvg1.hide();

def SlimmerMA2 = MovingAverage(SlimmerMAType, price, SlimmerMALength2);
plot SlimmerMovAvg2 = SlimmerMA2;
SlimmerMovAvg2.SetDefaultColor(Color.YELLOW);
SlimmerMovAvg2.SetLineWeight(2);
SlimmerMovAvg2.hide();

def SlimmerMA3 = MovingAverage(SlimmerMAType, price, SlimmerMALength3);
plot SlimmerMovAvg3 = SlimmerMA3;
SlimmerMovAvg3.SetDefaultColor(Color.RED);
SlimmerMovAvg3.SetLineWeight(2);
SlimmerMovAvg3.hide();


input applySelectSmoothing = yes;

def smooth_MA1 = EhlersSuperSmootherFilter(MovingAverage(SlimmerMAType, price, SlimmerMALength1));
def smooth_MA2 = EhlersSuperSmootherFilter(MovingAverage(SlimmerMAType, price, SlimmerMALength2));
def smooth_MA3 = EhlersSuperSmootherFilter(MovingAverage(SlimmerMAType, price, SlimmerMALength3));

input SelectSmoothingType = {default "Smooth MAs", "No Smoothing"};

plot X;
X.SetDefaultColor(Color.GREEN);
X.SetLineWeight(2);
plot Y;
Y.SetDefaultColor(Color.YELLOW);
Y.SetLineWeight(2);
plot Z;
Z.SetDefaultColor(Color.RED);
Z.SetLineWeight(2);

switch (SelectSmoothingType) {
case "Smooth MAs":
    X = if applySelectSmoothing and SlimmerMA1 then smooth_MA1 else SlimmerMA1;
    Y = if applySelectSmoothing and SlimmerMA2 then smooth_MA2 else SlimmerMA2;
    Z = if applySelectSmoothing and SlimmerMA3 then smooth_MA3 else SlimmerMA3;
case "No Smoothing":
    X = if applySelectSmoothing and SlimmerMA1 then SlimmerMA1 else SlimmerMA1;
    Y = if applySelectSmoothing and SlimmerMA2 then SlimmerMA2 else SlimmerMA2;
    Z = if applySelectSmoothing and SlimmerMA3 then SlimmerMA3 else SlimmerMA3;
}
;
Last edited:
 Take it for a test drive...