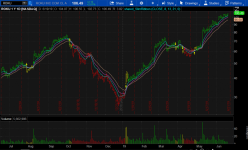
SLIM Ribbon Indicator for ThinkorSwim

markos

Well-known member
VIP
Mr. Slim Miller was one of the original OEX pit traders at the CBOE. His website is askSLIM dot com.

This indicator is very customizable. Alerts are built in, you can use regular candles if you wish, you can turn all of the EMA's off and the color of the ribbon will still be there.

If you cannot find what you are looking for when you click the cog, open the code itself and take a look at what is there. This indicator also overrides the color of your volume bars. Lastly, this indicator is good for any timeframe without adjusting the EMA's.
Try it with a TMO or the RSI Laguerre on the bottom. Good trading, Markos.


vcD0LTm.png


thinkScript Code

Rich (BB code):
#Mr Slim Miller at askSLIM dot com
#SlimRibbonCustom_markos9-7-18

input price = close;
input superfast_length = 8;
input fast_length = 13;
input slow_length = 21;
input displace = 0;

def mov_avg8 = ExpAverage(price[-displace], superfast_length);
def mov_avg13 = ExpAverage(price[-displace], fast_length);
def mov_avg21 = ExpAverage(price[-displace], slow_length);

plot Slow = mov_avg21;
def buy = mov_avg8 > mov_avg13 and mov_avg13 > mov_avg21 and low > mov_avg8;
def stopbuy = mov_avg8 <= mov_avg13;
def buynow = !buy[1] and buy;
def buysignal = CompoundValue(1, if buynow and !stopbuy then 1 else if buysignal[1]==1 and stopbuy then 0 else buysignal[1], 0);

def sell = mov_avg8 < mov_avg13 and mov_avg13 < mov_avg21 and high < mov_avg8;
def stopsell = mov_avg8 >= mov_avg13;
def sellnow = !sell[1] and sell;
def sellsignal = CompoundValue(1, if sellnow and !stopsell then 1 else if sellsignal[1]==1 and stopsell then 0 else sellsignal[1], 0);

# Charting & Formatting
Plot Superfast = mov_avg8;
plot Fast = mov_avg13;

plot Buy_Signal = buysignal[1] == 0 and buysignal==1;
     Buy_signal.setpaintingStrategy(PaintingStrategy.BOOLEAN_ARROW_UP);
     Buy_signal.setdefaultColor(color.dark_GREEN);
     Buy_signal.hidetitle();

plot Momentum_Down = buysignal[1] ==1 and buysignal==0;
     Momentum_down.setpaintingStrategy(PaintingStrategy.BOOLEAN_ARROW_DOWN);
     Momentum_Down.setdefaultColor(color.yellow);
     Momentum_down.hidetitle();


Plot Sell_Signal = sellsignal[1] ==0 and sellsignal;
     Sell_signal.setpaintingStrategy(PaintingStrategy.BOOLEAN_ARROW_down);
     sell_signal.setDefaultColor(color.red);
     Sell_signal.hidetitle();


Plot Momentum_Up = sellsignal[1]==1 and sellSignal==0;
     Momentum_up.setpaintingStrategy(PaintingStrategy.BOOLEAN_ARROW_up);
     Momentum_up.setDefaultColor(color.yellow);
     Momentum_up.hidetitle();

Alert(condition = buysignal[1] == 0 and buysignal == 1, text = "Buy Signal", sound = Sound.Bell, "alert type" = Alert.BAR);
Alert(condition = buysignal[1] == 1 and buysignal == 0, text = "Momentum_Down", sound = Sound.Bell, "alert type" = Alert.BAR);
Alert(condition = sellsignal[1] == 0 and sellsignal == 1, text = "Sell Signal", sound = Sound.Bell, "alert type" = Alert.BAR);
Alert(condition = sellsignal[1] == 1 and sellSignal == 0, text = "Momentum_Up", sound = Sound.Bell, "alert type" = Alert.BAR);


plot Colorbars = if buysignal ==1 then 1 else if sellsignal ==1 then 2 else if buysignal ==0 or sellsignal==0 then 3 else 0;
     colorbars.hide();
     Colorbars.definecolor("Buy_Signal_Bars", color.dark_green);
     Colorbars.definecolor("Sell_Signal_Bars", color.red);
     Colorbars.definecolor("Neutral", color.yellow);

AssignPriceColor(
if Colorbars ==1 then colorbars.color("buy_signal_bars") else 
if colorbars ==2 then colorbars.color("Sell_Signal_bars") else  colorbars.color("neutral"));

#end

Shareable Link

https://tos.mx/zbybTc
 

Attachments

  • vcD0LTm.png
    vcD0LTm.png
    215.2 KB · Views: 430
Last edited by a moderator:

Join useThinkScript to post your question to a community of 21,000+ developers and traders.

@Likos ,I see you are working with Arvi's version of SlimRibbons. Good Choice.
Slim gave me a copy himself a few years back. (He taught in a chat room)
I use slim ribbons on almost everything on my Android and have no trouble with any time frame.
1. Please tell me what time frame you are looking to use most often.
2. What indicators due you have on the same mobile screen
3. Do you have a problem with Heiken Ashi?
4. Are you using Android?
5. Do you use light or dark background?

@BenTen Please move this thread under my June 20th thread as noted in the similar threads listing below. It may take a little time, but I'll get him set up with screen shots.

Time frame at least 3min to 10min.

I took out all indicators to see if this would function on the app but results remain the same.

I'm more or a candle stick person than heiken user.

Android

Dark background
 
Time frame at least 3min to 10min.
I took out all indicators to see if this would function on the app but results remain the same.
I'm more or a candle stick person than heiken user.
Android
Dark background
@Likos Please remember that due to mobile's ability to display, many studies that might work on mobile will not look the same way as on desktop.
Without a picture to go by, here's what I have found: Turn off the COLORBARS. That should fix the problem.
7M2FOBSm.jpg
 
Here's the app version removing color bars

https://ibb.co/NjYdPBw
Unfortunately, the laptop/desktop version wins because it's very precise & accurate, whereas the app is more or less... all over the place with the exception of support/resistance tools.
 
2 things I notice:
A. very few indicators work well on penny stocks - the spreads are too wide.
B. There are too many indicators on your chart

I see. Are there any particular indicators I should be looking at or relying in terms of day trading? For someone low budget I only look via between 0.20 down to $5
 
The quoted link above is not for the SLIM Ribbon, I'm getting what looks like an oscillator in the lower pane.
----
This SLIM Ribbon is the same as having the 3-in-1 EMA 8-13-21 indicator (vs 5,8,13 I was using), but with colored bars and signals.
 
Last edited:
I see. Are there any particular indicators I should be looking at or relying in terms of day trading? For someone low budget I only look via between 0.20 down to $5
@Likos I don't have an answer for indicators. Because the Bid/Ask are often very wide, it messes with indicators somewhat.
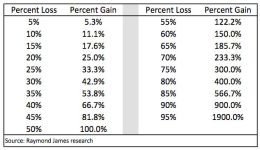
I can't give investment advice but if one is on a low budget, the only way to have $1000 or even $500 to invest is save like crazy and stop looking for a holy grail. There is none. A person generally would be better buying 10 shares of a $100 stock than 1000 shares of a $1 stock. There is a reason that price is where it is. Lastly, I'll leave you with this: If you buy a $1 stock and turnaround and sell for .90 cents, you have to make up 11.1% on your next transaction just to break even.
rM7QKqm.png
 

Attachments

  • rM7QKqm.png
    rM7QKqm.png
    170.6 KB · Views: 222
@thinky You are getting good. Congrats on understanding an indicator. Did you quit using 5,8,13 ? Why ? Have you tried SMA 5,8,13 and then a 30 as a support/resistance line.
 
@thinky You are getting good. Congrats on understanding an indicator. Did you quit using 5,8,13 ? Why ? Have you tried SMA 5,8,13 and then a 30 as a support/resistance line.
@horserider @thinky The nice thing about the Slim Ribbon is that the numbers are easy to change in the U.I. Nothing wrong with trying different things for your time frame. After you try an SMA(30), try a Hull(10) or Hull(20) and use the color change that's built into that as a signal. Test them out, and have fun.
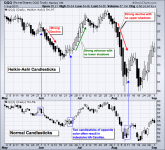
BTW, if your not particular, it looks real pretty using bright colors on Black w Heiken Ashi Candles.
 
Last edited:
@horserider
Have 5-8-13 with SMA on the chart for intraday, and since trying the new indicator left it at the default values.

Have not tried a 4th moving average (30), will look into it.

@markos
I think I need to replace "ExpAverage" in the code to use HMA. Did you mean replacing 4 EMA's for HMA's?

The 3-in-1 code should show how to make the change in moving average an option in the indicator settings.

What @drdarshil16 mentioned makes sense, you need a shorter and a longer time frame to trade.
Only trade in direction of bigger timeframe indicator, Enter on lower timeframe confirmation

Trying to come up with a setup for weekly/intraday trading in ToS, things get crowded pretty quick. Using Charts section for even longer daily time frames (trendlines, S&R, MACD) and charts of other underlyings, while keeping the shorter time frames in the Flexible Grid section.
 
Last edited:
@markos
I think I need to replace "ExpAverage" in the code to use HMA. Did you mean replacing 4 EMA's for HMA's?
The 3-in-1 code should show how to make the change in moving average an option in the indicator settings.
What @drdarshil16 mentioned makes sense, you need a shorter and a longer time frame to trade.
Only trade in direction of bigger timeframe indicator, Enter on lower timeframe confirmation

@thinky Muliple time frames should always be available for use. What @drdarshil16 said is how Fractal Trading is taught.
Try this 2 chart grid: https://tos.mx/LldzdS Here's Doc Severson's 4 and 3 Grid MTF: https://tos.mx/xUvrwP https://tos.mx/TT4o72
If practical, they should be like such: 78 minute, Daily, Weekly, Monthly -or- 5 minute, 15, 1 hour, 4 Hour. Or whatever set up suits you.

Don't mess with the code of the Slim Ribbon. They are never changed. Did you see Slim's video? https://askslim.com/slim-ribbon/

Just as @horserider mentioned, putting a 30 day SMA or other separate MovAve as support/resistance guideline may help.

My suggestion about the Hull was just to explore what happens. I certainly could be full of soup.
With the built in Hull Study, the signal is when color changes. You'll notice that they have large swings. Ignore that. It's the color changes that matters.
Have fun, Markos
 
Last edited:
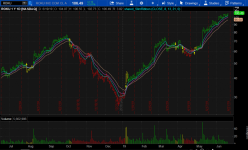
Mr. Slim Miller was one of the original OEX pit traders at the CBOE. His website is askSLIM dot com.

This indicator is very customizable. Alerts are built in, you can use regular candles if you wish, you can turn all of the EMA's off and the color of the ribbon will still be there.

If you cannot find what you are looking for when you click the cog, open the code itself and take a look at what is there. This indicator also overrides the color of your volume bars. Lastly, this indicator is good for any timeframe without adjusting the EMA's.
Try it with a TMO or the RSI Laguerre on the bottom. Good trading, Markos.


vcD0LTm.png


thinkScript Code

Rich (BB code):
#Mr Slim Miller at askSLIM dot com
#SlimRibbonCustom_markos9-7-18
input price = close;

input superfast_length = 8;

input fast_length = 13;

input slow_length = 21;

input displace = 0;

def mov_avg8 = ExpAverage(price[-displace], superfast_length);

def mov_avg13 = ExpAverage(price[-displace], fast_length);

def mov_avg21 = ExpAverage(price[-displace], slow_length);

#moving averages

Plot Superfast = mov_avg8;

plot Fast = mov_avg13;

plot Slow = mov_avg21;

def buy = mov_avg8 > mov_avg13 and mov_avg13 > mov_avg21 and low > mov_avg8;

def stopbuy = mov_avg8 <= mov_avg13;

def buynow = !buy[1] and buy;

def buysignal = CompoundValue(1, if buynow and !stopbuy then 1 else if buysignal[1]==1 and stopbuy then 0 else buysignal[1], 0);

plot Buy_Signal = buysignal[1] == 0 and buysignal==1;

Buy_signal.setpaintingStrategy(PaintingStrategy.BOOLEAN_ARROW_UP);

Buy_signal.setdefaultColor(color.dark_GREEN);

Buy_signal.hidetitle();

Alert(condition = buysignal[1] == 0 and buysignal == 1, text = "Buy Signal", sound = Sound.Bell, "alert type" = Alert.BAR);

plot Momentum_Down = buysignal[1] ==1 and buysignal==0;

Momentum_down.setpaintingStrategy(PaintingStrategy.BOOLEAN_ARROW_DOWN);

Momentum_Down.setdefaultColor(color.yellow);

Momentum_down.hidetitle();

Alert(condition = buysignal[1] == 1 and buysignal == 0, text = "Momentum_Down", sound = Sound.Bell, "alert type" = Alert.BAR);

def sell = mov_avg8 < mov_avg13 and mov_avg13 < mov_avg21 and high < mov_avg8;

def stopsell = mov_avg8 >= mov_avg13;

def sellnow = !sell[1] and sell;

def sellsignal = CompoundValue(1, if sellnow and !stopsell then 1 else if sellsignal[1]==1 and stopsell then 0 else sellsignal[1], 0);

Plot Sell_Signal = sellsignal[1] ==0 and sellsignal;

Sell_signal.setpaintingStrategy(PaintingStrategy.BOOLEAN_ARROW_down);

sell_signal.setDefaultColor(color.red);

Sell_signal.hidetitle();

Alert(condition = sellsignal[1] == 0 and sellsignal == 1, text = "Sell Signal", sound = Sound.Bell, "alert type" = Alert.BAR);

Plot Momentum_Up = sellsignal[1]==1 and sellSignal==0;

Momentum_up.setpaintingStrategy(PaintingStrategy.BOOLEAN_ARROW_up);

Momentum_up.setDefaultColor(color.yellow);

Momentum_up.hidetitle();

Alert(condition = sellsignal[1] == 1 and sellSignal == 0, text = "Momentum_Up", sound = Sound.Bell, "alert type" = Alert.BAR);

plot Colorbars = if buysignal ==1 then 1 else if sellsignal ==1 then 2 else if buysignal ==0 or sellsignal==0 then 3 else 0;

colorbars.hide();

Colorbars.definecolor("Buy_Signal_Bars", color.dark_green);

Colorbars.definecolor("Sell_Signal_Bars", color.red);

Colorbars.definecolor("Neutral", color.yellow);

AssignPriceColor(if Colorbars ==1 then colorbars.color("buy_signal_bars") else if colorbars ==2 then colorbars.color("Sell_Signal_bars") else  colorbars.color("neutral"));

#end

Shareable Link

https://tos.mx/zbybTc
Hello, could you add preference to turn the Ribbons off just so the candles show? much appreciated thanks
 

Attachments

  • vcD0LTm.png
    vcD0LTm.png
    215.2 KB · Views: 236
Hello, could you add preference to turn the Ribbons off just so the candles show? much appreciated thanks
@Trading51 Slim thought of everything when he built this indicator. You can do that right in the settings. Trial and error.
I used to make the arrows Hot Pink and Lime Green just to make me feel like I was back in the 1970's. :cool:

From post # 16:
Don't mess with the code of the Slim Ribbon. They are never changed. Did you see Slim's video? https://askslim.com/slim-ribbon/
 

Similar threads

Not the exact question you're looking for?

Start a new thread and receive assistance from our community.

87k+ Posts
298 Online
Create Post

Similar threads

Similar threads

The Market Trading Game Changer

Join 2,500+ subscribers inside the useThinkScript VIP Membership Club
  • Exclusive indicators
  • Proven strategies & setups
  • Private Discord community
  • ‘Buy The Dip’ signal alerts
  • Exclusive members-only content
  • Add-ons and resources
  • 1 full year of unlimited support

Frequently Asked Questions

What is useThinkScript?

useThinkScript is the #1 community of stock market investors using indicators and other tools to power their trading strategies. Traders of all skill levels use our forums to learn about scripting and indicators, help each other, and discover new ways to gain an edge in the markets.

How do I get started?

We get it. Our forum can be intimidating, if not overwhelming. With thousands of topics, tens of thousands of posts, our community has created an incredibly deep knowledge base for stock traders. No one can ever exhaust every resource provided on our site.

If you are new, or just looking for guidance, here are some helpful links to get you started.

What are the benefits of VIP Membership?
VIP members get exclusive access to these proven and tested premium indicators: Buy the Dip, Advanced Market Moves 2.0, Take Profit, and Volatility Trading Range. In addition, VIP members get access to over 50 VIP-only custom indicators, add-ons, and strategies, private VIP-only forums, private Discord channel to discuss trades and strategies in real-time, customer support, trade alerts, and much more. Learn all about VIP membership here.
How can I access the premium indicators?
To access the premium indicators, which are plug and play ready, sign up for VIP membership here.
Back
Top