
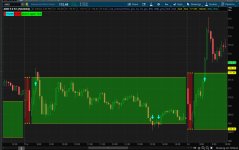
I am a new trader and have no coding experience. Is there currently a script that will plot the cloud red opening range (9:30-10am)? After input, the market open time and the time the opening range finishes. As time progresses through the OR, I would like the peak high and low to be constantly updated and revised backward using the declared full range operator. The indicator red shades the OR timeframe and then turns green once the OR is completed. Here a picture for clarity, disregard the candles, just want the cloud range. Can anyone help?

-
Happy Father's Day! For a limited time: take $50 off VIP Membership with code DAD50 Claim Discount
You are using an out of date browser. It may not display this or other websites correctly.
You should upgrade or use an alternative browser.
You should upgrade or use an alternative browser.
Shaded Opening Range (No Breakout)
- Thread starter Malpal01
- Start date
I am a new trader and have no coding experience. Is there currently a script that will plot the cloud red opening range (9:30-10am)? After input, the market open time and the time the opening range finishes. As time progresses through the OR, I would like the peak high and low to be constantly updated and revised backward using the declared full range operator. The indicator red shades the OR timeframe and then turns green once the OR is completed. Here a picture for clarity, disregard the candles, just want the cloud range. Can anyone help?
here is an old version of ORB, i made years ago, modified to have clouds
Code:
#orb_colors

#https://usethinkscript.com/threads/shaded-opening-range-no-breakout.17922/
#Shaded Opening Range (No Breakout)

# 2020-01
# halcyonguy
def na = Double.NaN;

input timeframe = { t1min , t2min , t3min , t5min , t10min , default t15min , t30min };
input show_ORB_label = yes;

input show_range_lines = no;
def srl = show_range_lines;

input orb_range_lines_pricepercent = 16;
def olpp = orb_range_lines_pricepercent;

input show_arrows = yes;


# open/close times  (ET)
input start = 0930;
input end = 1600;

def daytime = if secondsfromTime(start) >= 0 and secondstillTime(end) > 0 then 1 else 0;

def agg;
def per;
switch (timeframe) {
case t1min:
    agg = AggregationPeriod.MIN;
    per = 1;
case t2min:
    agg = AggregationPeriod.two_MIN;
    per = 2;
case t3min:
    agg = AggregationPeriod.three_MIN;
    per = 3;
case t5min:
    agg = AggregationPeriod.fIVE_MIN;
    per = 5;
case t10min:
    agg = AggregationPeriod.Ten_MIN;
    per = 10;
case t15min:
    agg = AggregationPeriod.FIFTEEN_MIN;
    per = 15;
case t30min:
    agg = AggregationPeriod.THIRTY_MIN;
    per = 30;
}


addlabel(show_ORB_label, per + "ORB" , color.cyan);


# get candle width , seconds , timeframe
#def getaggmin = round(getaggregationPeriod()/60,0);
def getgg = getaggregationPeriod();
def getaggmin = round(getgg/60,0);

addlabel(yes,getaggmin);


# test if agg time is > than chart time
def aggok = if (getaggmin*60) <= agg then 1 else 0;
#addlabel(!aggok, "chart time too long" );
#  doesn't display this if chart time longer.  shows err sym  top left


def durationsec = per * 60;
def secondspassed = secondsfromTime(start);
#  simulated firstbar , based on orb time
def firstbar = if secondspassed >= 0 and secondspassed < durationsec then 1 else 0;
#addchartbubble(yes,low,per + "__" + firstbar + "__" + agg);
def afterfirst = if ( daytime and !firstbar ) then 1 else 0;

# is this the first bar after open ?
def openbar = if secondspassed >= 0 and secondspassed <= getgg then 1 else 0;


def ehi = high(period = agg);
def elo = low(period = agg);

#  looks at firstbar ,  which is orbtime ,  NOT bar[1]
def perhigh = if !daytime then na else if firstbar then ehi else perhigh[1];


# use openbar -  is it the first bar ?  from getgg
#def perhigh = if !daytime then na else if openbar then ehi else perhigh[1];

def perlow = if !daytime then na else if firstbar then elo else perlow[1];


# .....................................................

# calc % tolerance levels within orb lines
# def olpp = orblines_pricepercent;
def linediff = perhigh - perlow;
def orbperamt = linediff * (olpp/100);
def orbupperper = perhigh - orbperamt;
def orblowerper = perlow + orbperamt;

def upperrng = if ( close < perhigh and close > orbupperper) then 1 else 0;
def lowerrng = if ( close > perlow and close < orblowerper) then 1 else 0;

addlabel(upperrng,"upper range", color.green);
addlabel(lowerrng,"lower range", color.red);
# chg these to background colors for watch column


# def srl = show_range_lines;
# draw lines at x% within orb lines
# plot dots for first bar timeframe
plot hiperdots = if (srl and daytime) then orbupperper else na;
plot loperdots = if (srl and daytime) then orblowerper else na;
hiperdots.setpaintingStrategy(paintingStrategy.points);
loperdots.setpaintingStrategy(paintingStrategy.pointS);
hiperdots.setDefaultColor(color.violet);
loperdots.setDefaultColor(color.violet);
hiperdots.hidebubble();
loperdots.hidebubble();


# .....................................................

# add label if beyond orb range
addlabel((close > perhigh),"above upper line", color.green);
addlabel((close < perlow),"below lower line", color.red);


# .....................................................

#  test data
#  show vars
#input vfac2 = 1;
#addchartBubble(yes, (high * vfac2), ehi + ".." + elo, color.cyan, yes);


# plot dots for first bar timeframe
plot hidots = if firstbar then perhigh else na;
plot lodots = if firstbar then perlow else na;
hidots.setpaintingStrategy(paintingStrategy.points);
lodots.setpaintingStrategy(paintingStrategy.pointS);
hidots.setDefaultColor(color.yellow);
lodots.setDefaultColor(color.yellow);


# plot line after first bar
plot hiline = if !firstbar then perhigh else na;
plot loline = if !firstbar then perlow else na;
hiline.setpaintingStrategy(paintingStrategy.line);
loline.setpaintingStrategy(paintingStrategy.line);
hiline.setDefaultColor(color.yellow);
loline.setDefaultColor(color.yellow);


DefineGlobalColor("orb",color.red);
DefineGlobalColor("orb_after",color.green);

input show_orb_cloud = yes;
def dottop = if show_orb_cloud then hidots else na;
def linetop = if show_orb_cloud then hiline else na;


addcloud(dottop, lodots, GlobalColor("orb"));
addcloud(linetop, loline, GlobalColor("orb_after"));


# input show_arrows = yes;
def afterabove = if (show_arrows and (close crosses above hiline)) then 1 else 0;
def afterbelow = if (show_arrows and (close crosses below loline)) then 1 else 0;


# plot arrows on crossover points
def vfac5 = .0014;
plot upline = if afterabove then (hiline * (1 - vfac5)) else na;
plot dwnline = if afterbelow then (loline * (1 + vfac5)) else na;
upline.setPaintingStrategy(paintingStrategy.ARROW_UP);
dwnline.setPaintingStrategy(paintingStrategy.ARROW_down);
upline.setDefaultColor(color.cyan);
dwnline.setDefaultColor(color.cyan);
upline.setlineWeight(4);
dwnline.setlineWeight(4);
upline.hideBubble();
dwnline.hideBubble();

#
Attachments
Join useThinkScript to post your question to a community of 21,000+ developers and traders.
I am a new trader and have no coding experience. Is there currently a script that will plot the cloud red opening range (9:30-10am)? After input, the market open time and the time the opening range finishes. As time progresses through the OR, I would like the peak high and low to be constantly updated and revised backward using the declared full range operator. The indicator red shades the OR timeframe and then turns green once the OR is completed. Here a picture for clarity, disregard the candles, just want the cloud range. Can anyone help?
i cleaned up my previous version,
i changed from,
. input time text,
. to choosing an agg time, for ORB time. this simplifies things a lot
removed reference line ( some % of hi lo lines)
Code:
#orb_colors_02

#https://usethinkscript.com/threads/shaded-opening-range-no-breakout.17922/
#Shaded Opening Range (No Breakout)

# 2020-01
# halcyonguy
def na = Double.NaN;

# pick an agg time
input orb_time = AggregationPeriod.fifteen_min;
def orb_min = orb_time/60000;
def per = orb_min;

input show_ORB_label = yes;
input show_arrows = yes;


# open/close times  (ET)
input start = 0930;
input end = 1600;
def daytime = if secondsfromTime(start) >= 0 and secondstillTime(end) > 0 then 1 else 0;

addlabel(show_ORB_label, per + "ORB" , color.cyan);

def getgg = getaggregationPeriod();
def getaggmin = round(getgg/60,0);

addlabel(yes,getaggmin);


# test if agg time is > than chart time
def aggok = if getaggmin <= orb_min then 1 else 0;


def durationsec = per * 60;
def secondspassed = secondsfromTime(start);
#  simulated firstbar , based on orb time
def firstbar = if secondspassed >= 0 and secondspassed < durationsec then 1 else 0;
#addchartbubble(yes,low,per + "__" + firstbar + "__" + agg);
def afterfirst = if ( daytime and !firstbar ) then 1 else 0;

# is this the first bar after open ?
def openbar = if secondspassed >= 0 and secondspassed <= getgg then 1 else 0;


def ehi = high(period = orb_time);
def elo = low(period = orb_time);

#  looks at firstbar ,  which is orbtime ,  NOT bar[1]
def perhigh = if !daytime then na else if firstbar then ehi else perhigh[1];

def perlow = if !daytime then na else if firstbar then elo else perlow[1];


# .....................................................

# add label if beyond orb range
addlabel((close > perhigh),"above upper line", color.green);
addlabel((close < perlow),"below lower line", color.red);


# .....................................................


# plot dots for first bar timeframe
plot hidots = if firstbar then perhigh else na;
plot lodots = if firstbar then perlow else na;
hidots.setpaintingStrategy(paintingStrategy.points);
lodots.setpaintingStrategy(paintingStrategy.pointS);
hidots.setDefaultColor(color.yellow);
lodots.setDefaultColor(color.yellow);


# plot line after first bar
plot hiline = if !firstbar then perhigh else na;
plot loline = if !firstbar then perlow else na;
hiline.setpaintingStrategy(paintingStrategy.line);
loline.setpaintingStrategy(paintingStrategy.line);
hiline.setDefaultColor(color.yellow);
loline.setDefaultColor(color.yellow);


DefineGlobalColor("orb",color.red);
DefineGlobalColor("orb_after",color.green);

input show_orb_cloud = yes;
def dottop = if show_orb_cloud then hidots else na;
def linetop = if show_orb_cloud then hiline else na;


addcloud(dottop, lodots, GlobalColor("orb"));
addcloud(linetop, loline, GlobalColor("orb_after"));


# input show_arrows = yes;
def afterabove = if (show_arrows and (close crosses above hiline)) then 1 else 0;
def afterbelow = if (show_arrows and (close crosses below loline)) then 1 else 0;


# plot arrows on crossover points
def vfac5 = .0014;
plot upline = if afterabove then (hiline * (1 - vfac5)) else na;
plot dwnline = if afterbelow then (loline * (1 + vfac5)) else na;
upline.setPaintingStrategy(paintingStrategy.ARROW_UP);
dwnline.setPaintingStrategy(paintingStrategy.ARROW_down);
upline.setDefaultColor(color.cyan);
dwnline.setDefaultColor(color.cyan);
upline.setlineWeight(4);
dwnline.setlineWeight(4);
upline.hideBubble();
dwnline.hideBubble();
#Thank you so much! Quick additional question, is it possible to code the script to plot on ticks. Currently does not show unless its on a 5-30 mins time. Currently using range- 20D 10ticks.
Unfortunately, you will find that many of the indicators on the forum are written for time-based charts.
They will only sometimes work, or partially work, on range and tick charts.
This means no, it is not possible to make this or many of the other forum indicators work on range, tick, renko charts.
Last edited:
I like your ORB indicator with the labels that show when above/below...so that the labels don't show only when above/below can you add one showing Yellow "Trading within ORB" when it's trading within?i cleaned up my previous version,
i changed from,
. input time text,
. to choosing an agg time, for ORB time. this simplifies things a lot
removed reference line ( some % of hi lo lines)
Code:#orb_colors_02 #https://usethinkscript.com/threads/shaded-opening-range-no-breakout.17922/ #Shaded Opening Range (No Breakout) # 2020-01 # halcyonguy def na = Double.NaN; # pick an agg time input orb_time = AggregationPeriod.fifteen_min; def orb_min = orb_time/60000; def per = orb_min; input show_ORB_label = yes; input show_arrows = yes; # open/close times (ET) input start = 0930; input end = 1600; def daytime = if secondsfromTime(start) >= 0 and secondstillTime(end) > 0 then 1 else 0; addlabel(show_ORB_label, per + "ORB" , color.cyan); def getgg = getaggregationPeriod(); def getaggmin = round(getgg/60,0); addlabel(yes,getaggmin); # test if agg time is > than chart time def aggok = if getaggmin <= orb_min then 1 else 0; def durationsec = per * 60; def secondspassed = secondsfromTime(start); # simulated firstbar , based on orb time def firstbar = if secondspassed >= 0 and secondspassed < durationsec then 1 else 0; #addchartbubble(yes,low,per + "__" + firstbar + "__" + agg); def afterfirst = if ( daytime and !firstbar ) then 1 else 0; # is this the first bar after open ? def openbar = if secondspassed >= 0 and secondspassed <= getgg then 1 else 0; def ehi = high(period = orb_time); def elo = low(period = orb_time); # looks at firstbar , which is orbtime , NOT bar[1] def perhigh = if !daytime then na else if firstbar then ehi else perhigh[1]; def perlow = if !daytime then na else if firstbar then elo else perlow[1]; # ..................................................... # add label if beyond orb range addlabel((close > perhigh),"above upper line", color.green); addlabel((close < perlow),"below lower line", color.red); # ..................................................... # plot dots for first bar timeframe plot hidots = if firstbar then perhigh else na; plot lodots = if firstbar then perlow else na; hidots.setpaintingStrategy(paintingStrategy.points); lodots.setpaintingStrategy(paintingStrategy.pointS); hidots.setDefaultColor(color.yellow); lodots.setDefaultColor(color.yellow); # plot line after first bar plot hiline = if !firstbar then perhigh else na; plot loline = if !firstbar then perlow else na; hiline.setpaintingStrategy(paintingStrategy.line); loline.setpaintingStrategy(paintingStrategy.line); hiline.setDefaultColor(color.yellow); loline.setDefaultColor(color.yellow); DefineGlobalColor("orb",color.red); DefineGlobalColor("orb_after",color.green); input show_orb_cloud = yes; def dottop = if show_orb_cloud then hidots else na; def linetop = if show_orb_cloud then hiline else na; addcloud(dottop, lodots, GlobalColor("orb")); addcloud(linetop, loline, GlobalColor("orb_after")); # input show_arrows = yes; def afterabove = if (show_arrows and (close crosses above hiline)) then 1 else 0; def afterbelow = if (show_arrows and (close crosses below loline)) then 1 else 0; # plot arrows on crossover points def vfac5 = .0014; plot upline = if afterabove then (hiline * (1 - vfac5)) else na; plot dwnline = if afterbelow then (loline * (1 + vfac5)) else na; upline.setPaintingStrategy(paintingStrategy.ARROW_UP); dwnline.setPaintingStrategy(paintingStrategy.ARROW_down); upline.setDefaultColor(color.cyan); dwnline.setDefaultColor(color.cyan); upline.setlineWeight(4); dwnline.setlineWeight(4); upline.hideBubble(); dwnline.hideBubble(); #
I like your ORB indicator with the labels that show when above/below...so that the labels don't show only when above/below can you add one showing Yellow "Trading within ORB" when it's trading within?
Code:
#orb_colors_03

#csricksdds  2/20
#I like your ORB indicator with the labels that show when above/below...so that the labels don't show only when above/below can you add one showing Yellow "Trading within ORB" when it's trading within?

def na = Double.NaN;

# pick an agg time
input orb_time = AggregationPeriod.fifteen_min;
def orb_min = orb_time/60000;
def per = orb_min;

input show_ORB_label = yes;
input show_arrows = yes;

# open/close times  (ET)
input start = 0930;
input end = 1600;
def daytime = if secondsfromTime(start) >= 0 and secondstillTime(end) > 0 then 1 else 0;

def getgg = getaggregationPeriod();
def getaggmin = round(getgg/60,0);

addlabel(0,getaggmin);

# test if agg time is > than chart time
def aggok = if getaggmin <= orb_min then 1 else 0;


def durationsec = per * 60;
def secondspassed = secondsfromTime(start);
#  simulated firstbar , based on orb time
def firstbar = if secondspassed >= 0 and secondspassed < durationsec then 1 else 0;
#addchartbubble(yes,low,per + "__" + firstbar + "__" + agg);
def afterfirst = if ( daytime and !firstbar ) then 1 else 0;

# is this the first bar after open ?
def openbar = if secondspassed >= 0 and secondspassed <= getgg then 1 else 0;

def ehi = high(period = orb_time);
def elo = low(period = orb_time);

#  looks at firstbar ,  which is orbtime ,  NOT bar[1]
def perhigh = if !daytime then na else if firstbar then ehi else perhigh[1];
def perlow = if !daytime then na else if firstbar then elo else perlow[1];

# .....................................................

addlabel(1, " ", color.black);
addlabel(show_ORB_label, per + " min ORB" , color.light_gray);

addlabel(1, " ", color.black);
addlabel((close > perhigh),"price above upper line", color.green);
addlabel((close < perlow),"price below lower line", color.red);
addlabel((close <= perhigh and close >= perlow),"price within ORB limits", color.yellow);
addlabel(1, " ", color.black);

# .....................................................

# plot dots for first bar timeframe
plot hidots = if firstbar then perhigh else na;
plot lodots = if firstbar then perlow else na;
hidots.setpaintingStrategy(paintingStrategy.points);
lodots.setpaintingStrategy(paintingStrategy.pointS);
hidots.setDefaultColor(color.yellow);
lodots.setDefaultColor(color.yellow);


# plot line after first bar
plot hiline = if !firstbar then perhigh else na;
plot loline = if !firstbar then perlow else na;
hiline.setpaintingStrategy(paintingStrategy.line);
loline.setpaintingStrategy(paintingStrategy.line);
hiline.setDefaultColor(color.yellow);
loline.setDefaultColor(color.yellow);

#DefineGlobalColor("orb",color.magenta);
#DefineGlobalColor("orb_after",color.gray);
DefineGlobalColor("orb",color.red);
DefineGlobalColor("orb_after",color.green);

input show_orb_cloud = yes;
def dottop = if show_orb_cloud then hidots else na;
def linetop = if show_orb_cloud then hiline else na;

addcloud(dottop, lodots, GlobalColor("orb"));
addcloud(linetop, loline, GlobalColor("orb_after"));

# input show_arrows = yes;
def afterabove = if (show_arrows and (close crosses above hiline)) then 1 else 0;
def afterbelow = if (show_arrows and (close crosses below loline)) then 1 else 0;

# plot arrows on crossover points
def vfac5 = .0014;
plot upline = if afterabove then (hiline * (1 - vfac5)) else na;
plot dwnline = if afterbelow then (loline * (1 + vfac5)) else na;
upline.setPaintingStrategy(paintingStrategy.ARROW_UP);
dwnline.setPaintingStrategy(paintingStrategy.ARROW_down);
upline.setDefaultColor(color.cyan);
dwnline.setDefaultColor(color.cyan);
upline.setlineWeight(4);
dwnline.setlineWeight(4);
upline.hideBubble();
dwnline.hideBubble();
#With much thanks I have made the following changes to suit myself for day trading purposes (I use 5min Heinkin Ashi candles and don't like to cover them up).Code:#orb_colors_03 #csricksdds 2/20 #I like your ORB indicator with the labels that show when above/below...so that the labels don't show only when above/below can you add one showing Yellow "Trading within ORB" when it's trading within? def na = Double.NaN; # pick an agg time input orb_time = AggregationPeriod.fifteen_min; def orb_min = orb_time/60000; def per = orb_min; input show_ORB_label = yes; input show_arrows = yes; # open/close times (ET) input start = 0930; input end = 1600; def daytime = if secondsfromTime(start) >= 0 and secondstillTime(end) > 0 then 1 else 0; def getgg = getaggregationPeriod(); def getaggmin = round(getgg/60,0); addlabel(0,getaggmin); # test if agg time is > than chart time def aggok = if getaggmin <= orb_min then 1 else 0; def durationsec = per * 60; def secondspassed = secondsfromTime(start); # simulated firstbar , based on orb time def firstbar = if secondspassed >= 0 and secondspassed < durationsec then 1 else 0; #addchartbubble(yes,low,per + "__" + firstbar + "__" + agg); def afterfirst = if ( daytime and !firstbar ) then 1 else 0; # is this the first bar after open ? def openbar = if secondspassed >= 0 and secondspassed <= getgg then 1 else 0; def ehi = high(period = orb_time); def elo = low(period = orb_time); # looks at firstbar , which is orbtime , NOT bar[1] def perhigh = if !daytime then na else if firstbar then ehi else perhigh[1]; def perlow = if !daytime then na else if firstbar then elo else perlow[1]; # ..................................................... addlabel(1, " ", color.black); addlabel(show_ORB_label, per + " min ORB" , color.light_gray); addlabel(1, " ", color.black); addlabel((close > perhigh),"price above upper line", color.green); addlabel((close < perlow),"price below lower line", color.red); addlabel((close <= perhigh and close >= perlow),"price within ORB limits", color.yellow); addlabel(1, " ", color.black); # ..................................................... # plot dots for first bar timeframe plot hidots = if firstbar then perhigh else na; plot lodots = if firstbar then perlow else na; hidots.setpaintingStrategy(paintingStrategy.points); lodots.setpaintingStrategy(paintingStrategy.pointS); hidots.setDefaultColor(color.yellow); lodots.setDefaultColor(color.yellow); # plot line after first bar plot hiline = if !firstbar then perhigh else na; plot loline = if !firstbar then perlow else na; hiline.setpaintingStrategy(paintingStrategy.line); loline.setpaintingStrategy(paintingStrategy.line); hiline.setDefaultColor(color.yellow); loline.setDefaultColor(color.yellow); #DefineGlobalColor("orb",color.magenta); #DefineGlobalColor("orb_after",color.gray); DefineGlobalColor("orb",color.red); DefineGlobalColor("orb_after",color.green); input show_orb_cloud = yes; def dottop = if show_orb_cloud then hidots else na; def linetop = if show_orb_cloud then hiline else na; addcloud(dottop, lodots, GlobalColor("orb")); addcloud(linetop, loline, GlobalColor("orb_after")); # input show_arrows = yes; def afterabove = if (show_arrows and (close crosses above hiline)) then 1 else 0; def afterbelow = if (show_arrows and (close crosses below loline)) then 1 else 0; # plot arrows on crossover points def vfac5 = .0014; plot upline = if afterabove then (hiline * (1 - vfac5)) else na; plot dwnline = if afterbelow then (loline * (1 + vfac5)) else na; upline.setPaintingStrategy(paintingStrategy.ARROW_UP); dwnline.setPaintingStrategy(paintingStrategy.ARROW_down); upline.setDefaultColor(color.cyan); dwnline.setDefaultColor(color.cyan); upline.setlineWeight(4); dwnline.setlineWeight(4); upline.hideBubble(); dwnline.hideBubble(); #
These are the changes I made:
Code:
#orb_colors_03

#csricksdds  2/20
#I like your ORB indicator with the labels that show when above/below...so that the labels don't show only when above/below can you add one showing Yellow "Trading within ORB" when it's trading within?
#Thanks to halcyonguy I have made a few changes to suit myself.

def na = Double.NaN;

# pick an agg time
input orb_time = AggregationPeriod.fifteen_min;
def orb_min = orb_time/60000;
def per = orb_min;

input show_ORB_label = yes;
input show_arrows = yes;

# open/close times  (ET)
input start = 0930;
input end = 1600;
def daytime = if secondsfromTime(start) >= 0 and secondstillTime(end) > 0 then 1 else 0;

def getgg = getaggregationPeriod();
def getaggmin = round(getgg/60,0);

addlabel(0,getaggmin);

# test if agg time is > than chart time
def aggok = if getaggmin <= orb_min then 1 else 0;

def durationsec = per * 60;
def secondspassed = secondsfromTime(start);
#  simulated firstbar , based on orb time
def firstbar = if secondspassed >= 0 and secondspassed < durationsec then 1 else 0;
#addchartbubble(yes,low,per + "" + firstbar + "" + agg);
def afterfirst = if ( daytime and !firstbar ) then 1 else 0;

# is this the first bar after open ?
def openbar = if secondspassed >= 0 and secondspassed <= getgg then 1 else 0;

def ehi = high(period = orb_time);
def elo = low(period = orb_time);

#  looks at firstbar ,  which is orbtime ,  NOT bar[1]
def perhigh = if !daytime then na else if firstbar then ehi else perhigh[1];
def perlow = if !daytime then na else if firstbar then elo else perlow[1];

# .....................................................

addlabel(1, " ", color.Yellow);
addlabel((close > perhigh),"Price Above ORB", color.green);
addlabel((close < perlow),"Price Below ORB", color.red);
addlabel((close <= perhigh and close >= perlow),"Price Inside ORB", color.yellow);
addlabel(1, " ", color.Yellow);

# .....................................................

# plot dots for first bar timeframe
plot hidots = if firstbar then perhigh else na;
plot lodots = if firstbar then perlow else na;
hidots.setpaintingStrategy(paintingStrategy.Dashes);
lodots.setpaintingStrategy(paintingStrategy.Dashes);
hidots.setDefaultColor(color.yellow);
lodots.setDefaultColor(color.yellow);

# plot line after first bar
plot hiline = if !firstbar then perhigh else na;
plot loline = if !firstbar then perlow else na;
hiline.setpaintingStrategy(paintingStrategy.LINE);
loline.setpaintingStrategy(paintingStrategy.LINE);
hiline.setDefaultColor(color.yellow);
loline.setDefaultColor(color.yellow);

#DefineGlobalColor("orb",color.magenta);
#DefineGlobalColor("orb_after",color.gray);
DefineGlobalColor("orb",color.red);
DefineGlobalColor("orb_after",color.green);

#End
Last edited by a moderator:
With much thanks I have made the following changes to suit myself for day trading purposes (I use 5min Heinkin Ashi candles and don't like to cover them up).
These are the changes I made:
#orb_colors_03
#csricksdds 2/20
#I like your ORB indicator with the labels that show when above/below...so that the labels don't show only when above/below can you add one showing Yellow "Trading within ORB" when it's trading within?
#Thanks to halcyonguy I have made a few changes to suit myself.
def na = Double.NaN;
# pick an agg time
input orb_time = AggregationPeriod.fifteen_min;
def orb_min = orb_time/60000;
def per = orb_min;
input show_ORB_label = yes;
input show_arrows = yes;
# open/close times (ET)
input start = 0930;
input end = 1600;
def daytime = if secondsfromTime(start) >= 0 and secondstillTime(end) > 0 then 1 else 0;
def getgg = getaggregationPeriod();
def getaggmin = round(getgg/60,0);
addlabel(0,getaggmin);
# test if agg time is > than chart time
def aggok = if getaggmin <= orb_min then 1 else 0;
def durationsec = per * 60;
def secondspassed = secondsfromTime(start);
# simulated firstbar , based on orb time
def firstbar = if secondspassed >= 0 and secondspassed < durationsec then 1 else 0;
#addchartbubble(yes,low,per + "" + firstbar + "" + agg);
def afterfirst = if ( daytime and !firstbar ) then 1 else 0;
# is this the first bar after open ?
def openbar = if secondspassed >= 0 and secondspassed <= getgg then 1 else 0;
def ehi = high(period = orb_time);
def elo = low(period = orb_time);
# looks at firstbar , which is orbtime , NOT bar[1]
def perhigh = if !daytime then na else if firstbar then ehi else perhigh[1];
def perlow = if !daytime then na else if firstbar then elo else perlow[1];
# .....................................................
addlabel(1, " ", color.Yellow);
addlabel((close > perhigh),"Price Above ORB", color.green);
addlabel((close < perlow),"Price Below ORB", color.red);
addlabel((close <= perhigh and close >= perlow),"Price Inside ORB", color.yellow);
addlabel(1, " ", color.Yellow);
# .....................................................
# plot dots for first bar timeframe
plot hidots = if firstbar then perhigh else na;
plot lodots = if firstbar then perlow else na;
hidots.setpaintingStrategy(paintingStrategy.Dashes);
lodots.setpaintingStrategy(paintingStrategy.Dashes);
hidots.setDefaultColor(color.yellow);
lodots.setDefaultColor(color.yellow);
# plot line after first bar
plot hiline = if !firstbar then perhigh else na;
plot loline = if !firstbar then perlow else na;
hiline.setpaintingStrategy(paintingStrategy.LINE);
loline.setpaintingStrategy(paintingStrategy.LINE);
hiline.setDefaultColor(color.yellow);
loline.setDefaultColor(color.yellow);
#DefineGlobalColor("orb",color.magenta);
#DefineGlobalColor("orb_after",color.gray);
DefineGlobalColor("orb",color.red);
DefineGlobalColor("orb_after",color.green);
#End
please post code in a code window,
on a new post,
look for </> in header,
to open a window.
type doesn't matter, ruby is similar.
i will try to edit your post
RjgrA
New member
This is the best ORB script i tried thanks @halcyonguy
im missing one feature , a mid point in line in the orb
this would make it perfect

im missing one feature , a mid point in line in the orb
this would make it perfect
RjgrA
New member
I added the midpoint to the ORB Script
Code:
#orb_colors_02

#https://usethinkscript.com/threads/shaded-opening-range-no-breakout.17922/
#Shaded Opening Range (No Breakout)

# 2020-01
# halcyonguy

def na = Double.NaN;

# pick an agg time
input orb_time = AggregationPeriod.fifteen_min;
def orb_min = orb_time/60000;
def per = orb_min;

input show_ORB_label = yes;
input show_arrows = yes;
input show_midpoint = yes; # Added input for midpoint

# open/close times  (ET)
input start = 0930;
input end = 1600;
def daytime = if secondsfromTime(start) >= 0 and secondstillTime(end) > 0 then 1 else 0;

addlabel(show_ORB_label, per + " ORB" , color.cyan);

def getgg = getaggregationPeriod();
def getaggmin = round(getgg/60,0);

addlabel(yes, getaggmin);

# test if agg time is > than chart time
def aggok = if getaggmin <= orb_min then 1 else 0;

def durationsec = per * 60;
def secondspassed = secondsfromTime(start);
# simulated firstbar , based on orb time
def firstbar = if secondspassed >= 0 and secondspassed < durationsec then 1 else 0;
def afterfirst = if ( daytime and !firstbar ) then 1 else 0;

# is this the first bar after open ?
def openbar = if secondspassed >= 0 and secondspassed <= getgg then 1 else 0;

def ehi = high(period = orb_time);
def elo = low(period = orb_time);

# looks at firstbar , which is orbtime , NOT bar[1]
def perhigh = if !daytime then na else if firstbar then ehi else perhigh[1];
def perlow = if !daytime then na else if firstbar then elo else perlow[1];
def permiddle = if !daytime then na else if firstbar then (ehi + elo)/2 else permiddle[1]; # Added midpoint calculation

# add label if beyond orb range
addlabel((close > perhigh), "above upper line", color.green);
addlabel((close < perlow), "below lower line", color.red);

# plot dots for first bar timeframe
plot hidots = if firstbar then perhigh else na;
plot lodots = if firstbar then perlow else na;
hidots.setpaintingStrategy(paintingStrategy.points);
lodots.setpaintingStrategy(paintingStrategy.points);
hidots.setDefaultColor(color.yellow);
lodots.setDefaultColor(color.yellow);

# plot line after first bar
plot hiline = if !firstbar then perhigh else na;
plot loline = if !firstbar then perlow else na;
plot midline = if !firstbar and show_midpoint then permiddle else na; # Added midpoint plot
hiline.setpaintingStrategy(paintingStrategy.line);
loline.setpaintingStrategy(paintingStrategy.line);
midline.setpaintingStrategy(paintingStrategy.line); # Set style for midpoint
hiline.setDefaultColor(color.yellow);
loline.setDefaultColor(color.yellow);
midline.setDefaultColor(color.white); # Distinct color for midpoint

DefineGlobalColor("orb", color.red);
DefineGlobalColor("orb_after", color.green);
DefineGlobalColor("orb_mid", color.white); # Added color for midpoint

input show_orb_cloud = yes;
def dottop = if show_orb_cloud then hidots else na;
def linetop = if show_orb_cloud then hiline else na;

addcloud(dottop, lodots, GlobalColor("orb"));
addcloud(linetop, loline, GlobalColor("orb_after"));

def afterabove = if (show_arrows and (close crosses above hiline)) then 1 else 0;
def afterbelow = if (show_arrows and (close crosses below loline)) then 1 else 0;

# plot arrows on crossover points
def vfac5 = .0014;
plot upline = if afterabove then (hiline * (1 - vfac5)) else na;
plot dwnline = if afterbelow then (loline * (1 + vfac5)) else na;
upline.setPaintingStrategy(paintingStrategy.ARROW_UP);
dwnline.setPaintingStrategy(paintingStrategy.ARROW_DOWN);
upline.setDefaultColor(color.cyan);
dwnline.setDefaultColor(color.cyan);
upline.setlineWeight(4);
dwnline.setlineWeight(4);
upline.hideBubble();
dwnline.hideBubble();As a person who doesn't like a lot of lines on my chart I use the VWAP instead of an ORB midline.This is the best ORB script i tried thanks @halcyonguy
im missing one feature , a mid point in line in the orb
this would make it perfect
View attachment 25100
| Thread starter | Similar threads | Forum | Replies | Date |
|---|---|---|---|---|
| S | MTF Shaded EMA | Questions | 4 | |
| S | Shaded area between two points (10% and 25% from recent high) | Questions | 1 | |
| R | nonworking Opening Range Breakout [Claude Ai] | Questions | 2 | |
| M | opening print with targets | Questions | 5 | |
|
|
Need help with Opening Range real-time midpoint plotting script | Questions | 2 |
Similar threads
-
-
Shaded area between two points (10% and 25% from recent high)
- Started by scottsamesame
- Replies: 1
-
-
-
 Need help with Opening Range real-time midpoint plotting script
- Started by MarcVUM
- Replies: 2
Not the exact question you're looking for?
Start a new thread and receive assistance from our community.
87k+
Posts
949
Online
Similar threads
-
-
Shaded area between two points (10% and 25% from recent high)
- Started by scottsamesame
- Replies: 1
-
-
-
Need help with Opening Range real-time midpoint plotting script
- Started by MarcVUM
- Replies: 2
Similar threads
-
-
Shaded area between two points (10% and 25% from recent high)
- Started by scottsamesame
- Replies: 1
-
-
-
Need help with Opening Range real-time midpoint plotting script
- Started by MarcVUM
- Replies: 2
The Market Trading Game Changer
Join 2,500+ subscribers inside the useThinkScript VIP Membership Club
- Exclusive indicators
- Proven strategies & setups
- Private Discord community
- ‘Buy The Dip’ signal alerts
- Exclusive members-only content
- Add-ons and resources
- 1 full year of unlimited support
Frequently Asked Questions
What is useThinkScript?
useThinkScript is the #1 community of stock market investors using indicators and other tools to power their trading strategies. Traders of all skill levels use our forums to learn about scripting and indicators, help each other, and discover new ways to gain an edge in the markets.
How do I get started?
We get it. Our forum can be intimidating, if not overwhelming. With thousands of topics, tens of thousands of posts, our community has created an incredibly deep knowledge base for stock traders. No one can ever exhaust every resource provided on our site.
If you are new, or just looking for guidance, here are some helpful links to get you started.
- The most viewed thread:
https://usethinkscript.com/threads/repainting-trend-reversal-for-thinkorswim.183/ - Our most popular indicator:
https://usethinkscript.com/threads/buy-the-dip-indicator-for-thinkorswim.3553/ - Answers to frequently asked questions:
https://usethinkscript.com/threads/answers-to-commonly-asked-questions.6006/
What are the benefits of VIP Membership?
VIP members get exclusive access to these proven and tested premium indicators: Buy the Dip, Advanced Market Moves 2.0, Take Profit, and Volatility Trading Range. In addition, VIP members get access to over 50 VIP-only custom indicators, add-ons, and strategies, private VIP-only forums, private Discord channel to discuss trades and strategies in real-time, customer support, trade alerts, and much more. Learn all about VIP membership here.
How can I access the premium indicators?
To access the premium indicators, which are plug and play ready, sign up for VIP membership here.