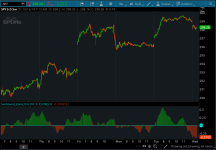
Here's a (forgotten but still useful) Sentiment Zone Oscillator. The Sentiment Zone Oscillator takes a sum of positive price candles over a user-specified window length. Normally, a triple exponential moving average of the sum is used, but we opted to just go with a double EMA for the sake of more responsiveness. When the histogram is green it is bullish and red/pink means bears.
thinkScript Code
Code:
# Sentiment Zone Oscillator
# Assembled by BenTen at useThinkScript.com
# Converted from https://www.tradingview.com/script/y3zfP2WG-Sentiment-Zone-Oscillator/

declare lower;

input len = 18;
input len1 = 9;
input src = close;

def r = if src > src[1] then 1 else -1;
def sm = expAverage(r, len);
def s = expAverage(sm, len1);

plot ZeroLine = 0;
plot Diff = s;

Diff.SetDefaultColor(GetColor(9));
Diff.SetPaintingStrategy(PaintingStrategy.HISTOGRAM);
Diff.SetLineWeight(3);
Diff.DefineColor("Up", Color.UPTICK);
Diff.DefineColor("Down", Color.DOWNTICK);
Diff.AssignValueColor(if sm > 0 then Diff.color("Up") else Diff.color("Down"));
