
diamondhands
New member
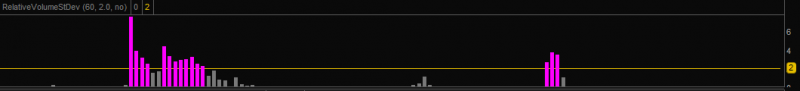
Hello, Can someone explain me why some of them are not showing and giving errors ?

| Thread starter | Similar threads | Forum | Replies | Date |
|---|---|---|---|---|
| S | Trade Ideas Intraday , single bar , Relative Volume RVOL For ThinkOrSwim | Indicators | 15 | |
| N | Relative Strength RP Labels For ThinkOrSwim | Indicators | 35 | |
|
|
ARSI - Adaptive Relative Strength Index for ThinkorSwim | Indicators | 15 | |
|
|
YungTrader's Relative Volume | Indicators | 17 | |
|
|
Relative Vigor Index (RVI) for ThinkorSwim | Indicators | 10 |
useThinkScript is the #1 community of stock market investors using indicators and other tools to power their trading strategies. Traders of all skill levels use our forums to learn about scripting and indicators, help each other, and discover new ways to gain an edge in the markets.
We get it. Our forum can be intimidating, if not overwhelming. With thousands of topics, tens of thousands of posts, our community has created an incredibly deep knowledge base for stock traders. No one can ever exhaust every resource provided on our site.
If you are new, or just looking for guidance, here are some helpful links to get you started.
")