Dear all,
Need help with explanation and/or possible solution.
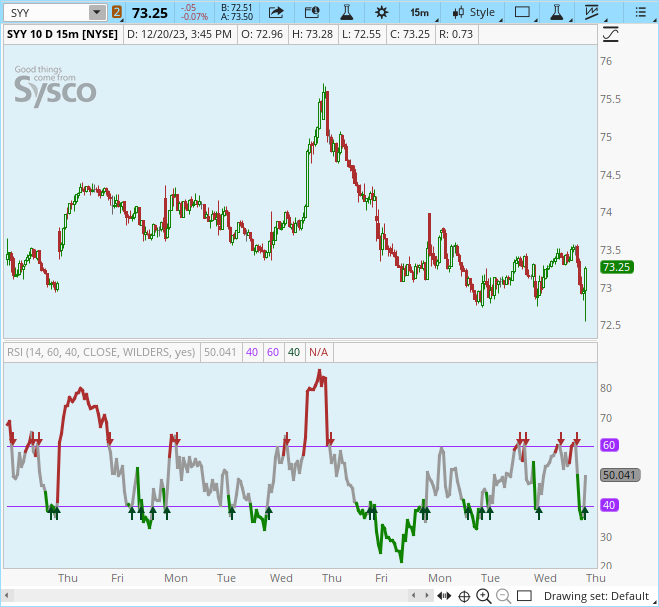
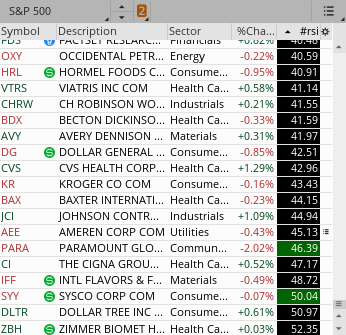
After moving logic from RSI study to watchlist column (preserving the same aggregation settings for chart vs watchlist column) the watchlist values are not consistent with "arrows" painting on the charts.
There are cases when arrows come and disappear immediately, while watchlist detecting and repeatedly reporting states. I tried adding condition to check last closed candle (see snipped below), but with no luck.
##########################################
# Momentum: RSI
script RSIMomentum {
input price = close;
input length = 14;
input over_bought = 60;
input over_sold = 40;
input rsiAverageType = AverageType.WILDERS;
def rsi = reference RSI(price = price, length = length, averageType = rsiAverageType);
def buySignal = rsi crosses above over_sold;
def sellSignal = rsi crosses below over_bought;
def lastClose = if !IsNaN(close) and IsNaN(close[-1]) then close else lastClose[1];
plot RSISignal = if (lastClose) then
(
if buySignal then 1 #Buy
else if sellSignal then -1 #Sell
else 0 #Neutral
) else Double.NaN;
#################END CODE
}
def _RSISignal = RSIMomentum().RSISignal;
AddLabel(yes, _RSISignal, COLOR.WHITE);
Thanks in advance
Need help with explanation and/or possible solution.
After moving logic from RSI study to watchlist column (preserving the same aggregation settings for chart vs watchlist column) the watchlist values are not consistent with "arrows" painting on the charts.
There are cases when arrows come and disappear immediately, while watchlist detecting and repeatedly reporting states. I tried adding condition to check last closed candle (see snipped below), but with no luck.
##########################################
# Momentum: RSI
script RSIMomentum {
input price = close;
input length = 14;
input over_bought = 60;
input over_sold = 40;
input rsiAverageType = AverageType.WILDERS;
def rsi = reference RSI(price = price, length = length, averageType = rsiAverageType);
def buySignal = rsi crosses above over_sold;
def sellSignal = rsi crosses below over_bought;
def lastClose = if !IsNaN(close) and IsNaN(close[-1]) then close else lastClose[1];
plot RSISignal = if (lastClose) then
(
if buySignal then 1 #Buy
else if sellSignal then -1 #Sell
else 0 #Neutral
) else Double.NaN;
#################END CODE
}
def _RSISignal = RSIMomentum().RSISignal;
AddLabel(yes, _RSISignal, COLOR.WHITE);
Thanks in advance