Hi All,
I have searched the community for examples to draw upon, but have come up empty. I'm hoping that someone can help me out.
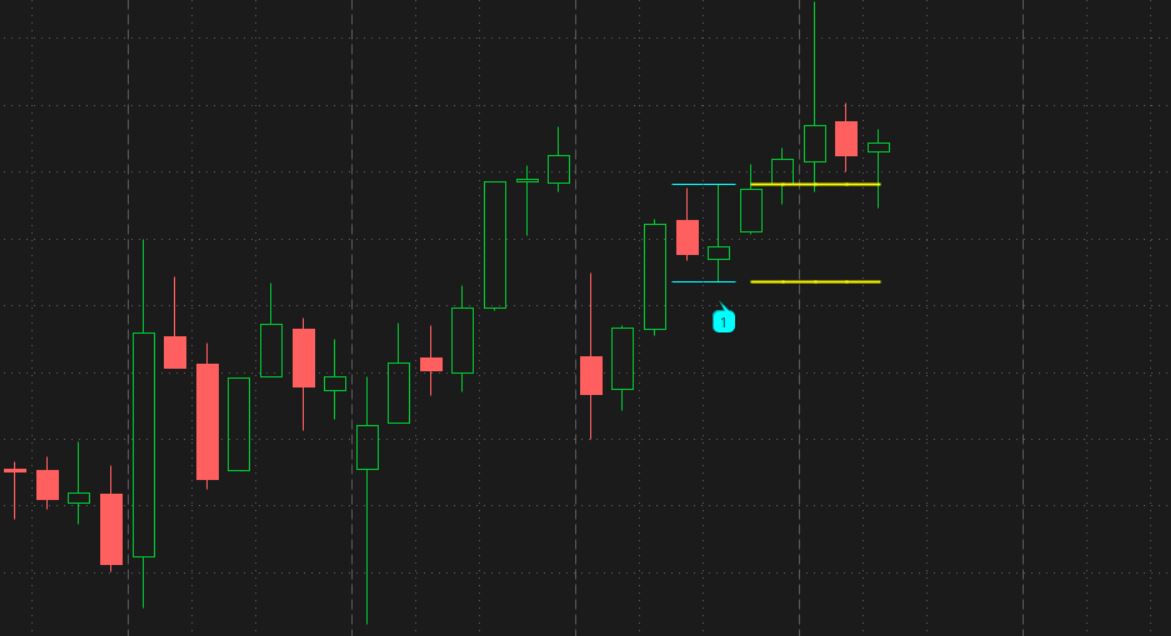
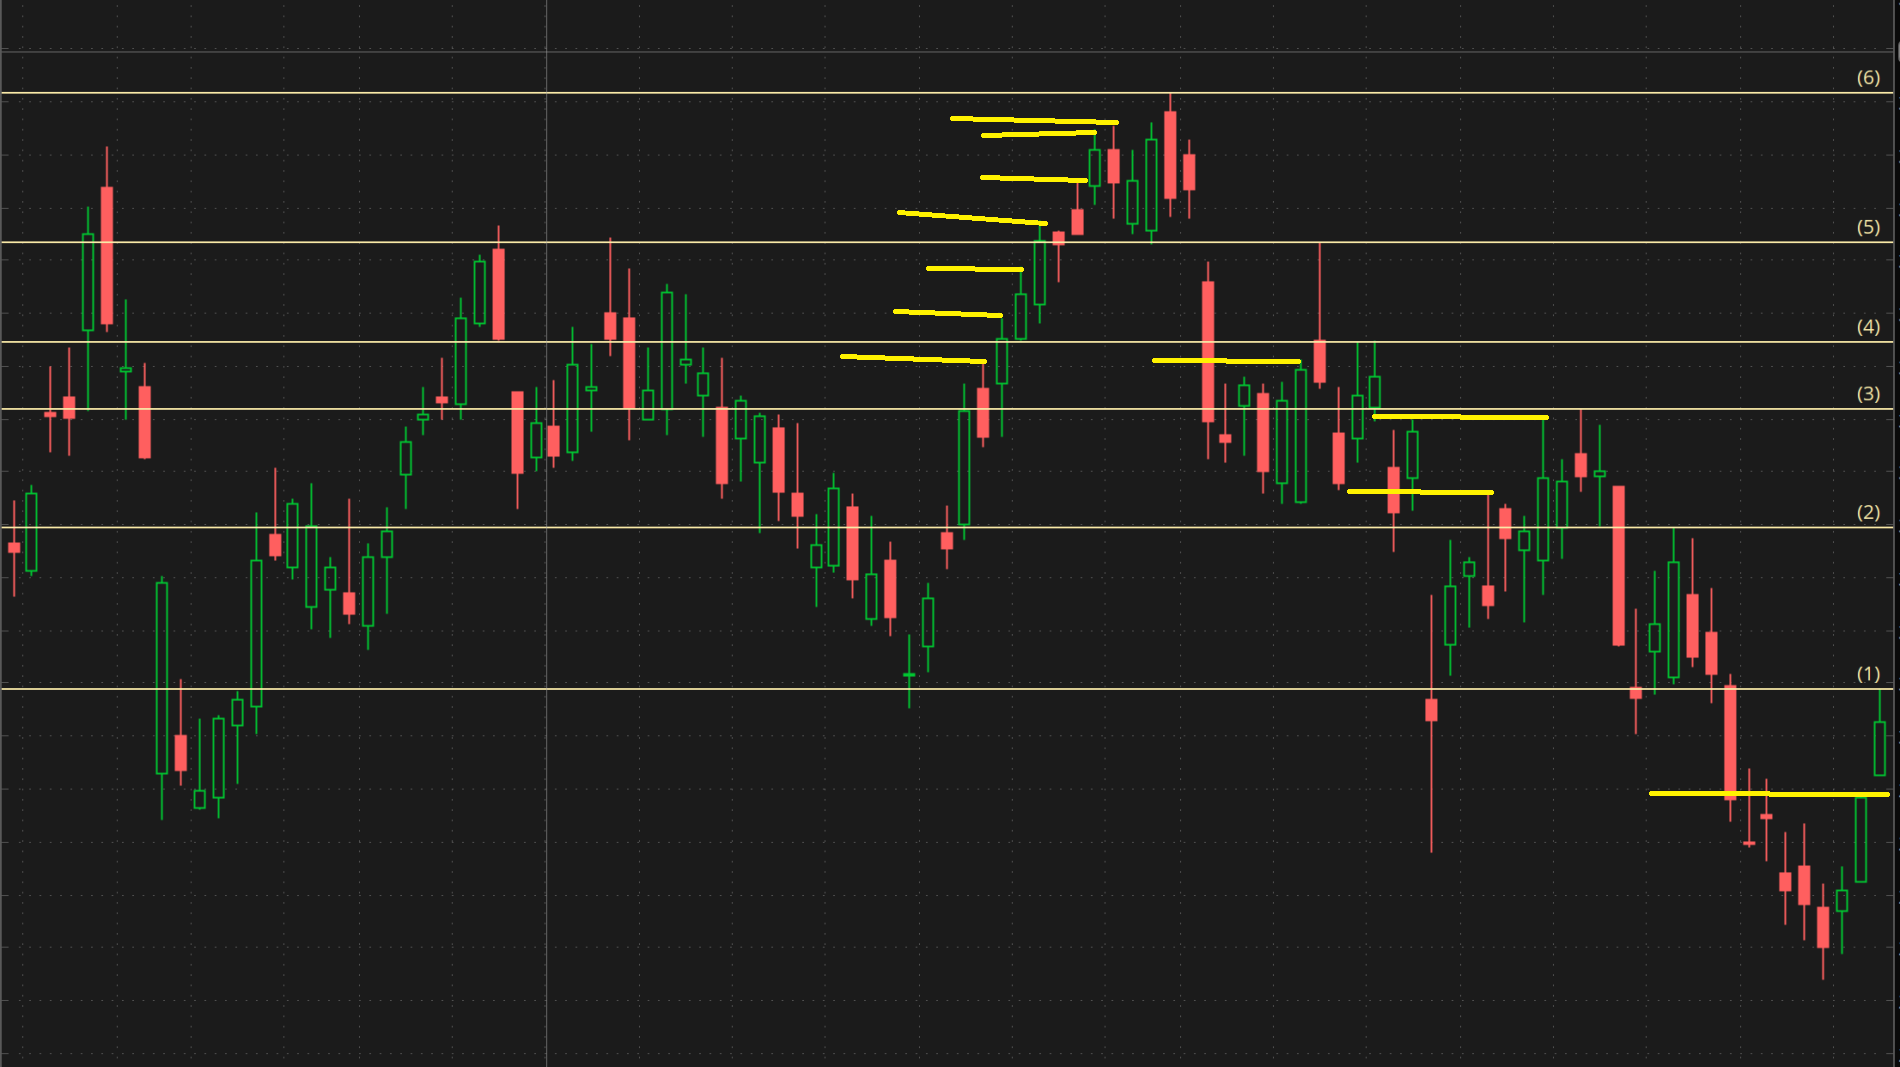
I am looking for an indicator that will draw a horizontal line at the high of each engulfing candle found in the given timeframe. I would like to find the engulfing candles starting from the most recent candle and working backwards (to the left). It would be great if the indicator supported an input for the minimum candles engulfed. It would also be ideal if the indicator erased previous horizontal lines that no longer qualify due to more recent price action.
Thank you.
I have searched the community for examples to draw upon, but have come up empty. I'm hoping that someone can help me out.
I am looking for an indicator that will draw a horizontal line at the high of each engulfing candle found in the given timeframe. I would like to find the engulfing candles starting from the most recent candle and working backwards (to the left). It would be great if the indicator supported an input for the minimum candles engulfed. It would also be ideal if the indicator erased previous horizontal lines that no longer qualify due to more recent price action.
Thank you.
Last edited: