Reverse Engulfing Indicator

Dap

New member
VIP
Hi All,

I have searched the community for examples to draw upon, but have come up empty. I'm hoping that someone can help me out.

I am looking for an indicator that will draw a horizontal line at the high of each engulfing candle found in the given timeframe. I would like to find the engulfing candles starting from the most recent candle and working backwards (to the left). It would be great if the indicator supported an input for the minimum candles engulfed. It would also be ideal if the indicator erased previous horizontal lines that no longer qualify due to more recent price action.

Thank you.
 
Last edited:
I can start you with an easy identifier for engulfing candles/bars.

I'm sure there are more elegant ways to set up the price coloring but I did include price shading for inside bars as well because there are times that inside and engulfing bars run together. I set the last two lines of the code intentionally so that you can "choose" your price color choice by simply moving the "#" to one line or the other depending on your wish at any given time.

Code:
input timeframe = aggregationperiod.day;

def h = high(period=aggregationperiod.day);
def l = low(period=aggregationperiod.day);

def engulf = (h > h[1]) and (l < l[1]);
def inside = (h < h[1]) and (l > l[1]);

## COLORING OF ENGULFING BARS ONLY ##

AssignPriceColor(if engulf then color.magenta else color.gray);

## COLORING OF ENGULFING AND INSIDE BARS ONLY ##

#AssignPriceColor(if engulf then color.magenta else if inside color.yellow else color.gray);
 
Hi All,

I have searched the community for examples to draw upon, but have come up empty. I'm hoping that someone can help me out.

I am looking for an indicator that will draw a horizontal line at the high of each engulfing candle found in the given timeframe. I would like to find the engulfing candles starting from the most recent candle and working backwards (to the left). It would be great if the indicator supported an input for the minimum candles engulfed. It would also be ideal if the indicator erased previous horizontal lines that no longer qualify due to more recent price action.

Thank you.

i modified my engulfing to,
..choose to show all engulfing or just the last one
..show high/low lines extending from the last engulf
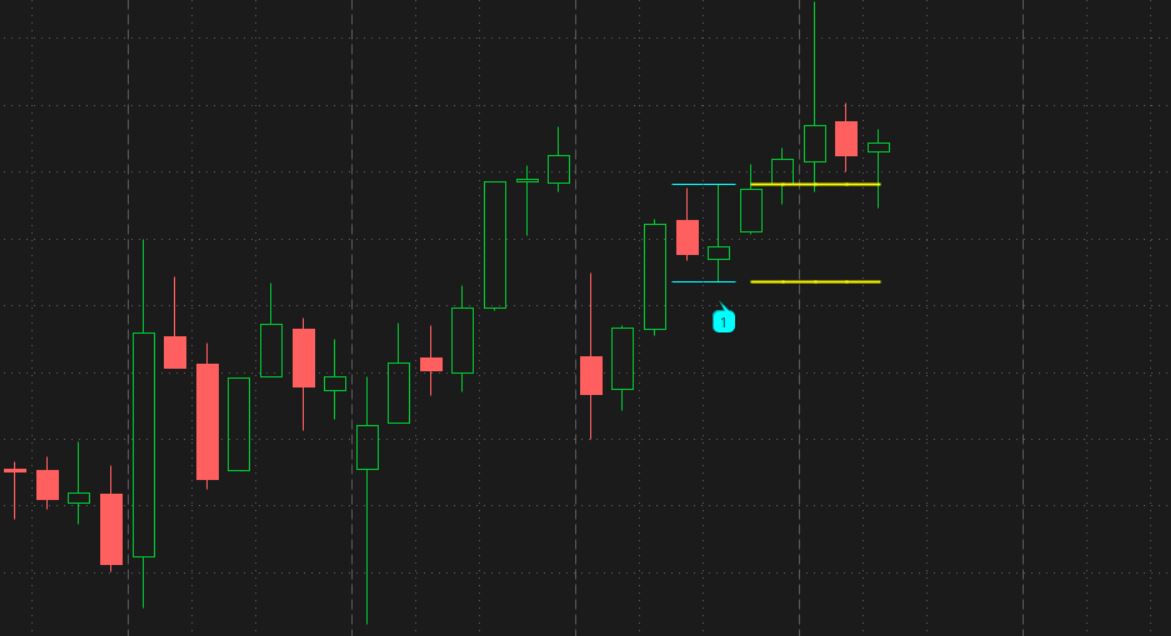
see it here:
https://usethinkscript.com/threads/...ith-various-quantities-of-smaller-bars.15055/

thanks @Cwparker23 for the link. i don't always remember what i did in the past.

SODqCte.jpg
 
Last edited by a moderator:
Thank you all for your help. I unfortunately misused the word "engulfing" in my description of the indicator. I apologize.

What I meant to say is that I am looking for an indicator that will draw a horizontal line at the high of a candle if that high takes out (is greater than) one or more candle highs that precedes it in a given timeframe. I would like to begin the process starting from the last candle printed and work backwards (to the left). It would be great if the indicator also supported an input for the minimum candles taken out. It would also be ideal if the indicator erased previous horizontal lines that no longer qualify due to more recent price action.

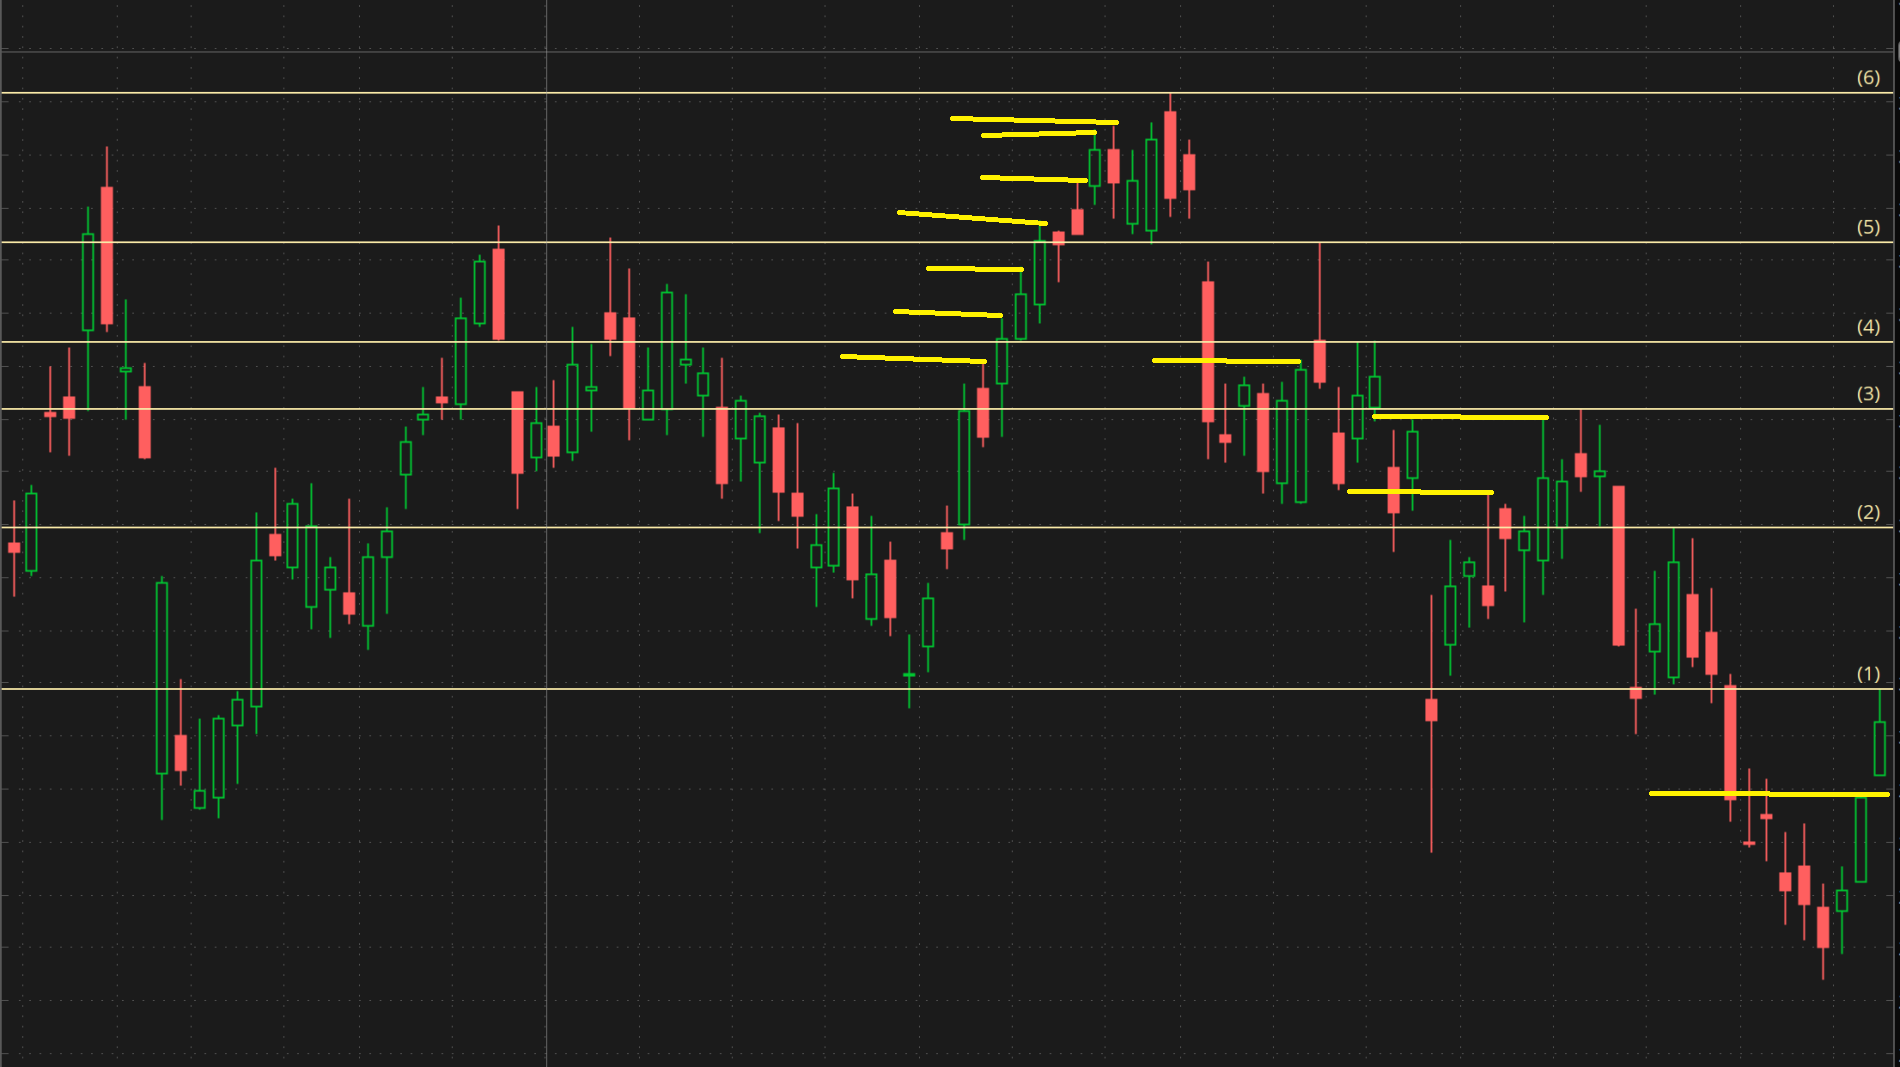
I hope this is clear. I have included a screenshot to show what I mean. The lines are numbered in the order that they were found when reading price action from the last candle printed working backwards.

Thank you for any help that you can provide.

Screenshot 2024-01-10 at 9.45.57 PM.png
 
Thank you all for your help. I unfortunately misused the word "engulfing" in my description of the indicator. I apologize.

What I meant to say is that I am looking for an indicator that will draw a horizontal line at the high of a candle if that high takes out (is greater than) one or more candle highs that precedes it in a given timeframe. I would like to begin the process starting from the last candle printed and work backwards (to the left). It would be great if the indicator also supported an input for the minimum candles taken out. It would also be ideal if the indicator erased previous horizontal lines that no longer qualify due to more recent price action.

I hope this is clear. I have included a screenshot to show what I mean. The lines are numbered in the order that they were found when reading price action from the last candle printed working backwards.

Thank you for any help that you can provide.


@Dap ,

'taken out' is too vague. write out what actually has to happen for a line to appear, using candle terms, high, low, close, open, > , < , ....

what does 'in a given timeframe' mean?
what does 'no longer qualify due to more recent price action' mean? price action means nothing. think about what has to happen.

posting a picture with no explanation, doesn't help
i marked it up. why aren't there lines where i added yellow lines?
B4pn3HL.png


if you can clearly define what has to happen, me or someone might be able to make it.
 
Last edited by a moderator:

Join useThinkScript to post your question to a community of 21,000+ developers and traders.

Similar threads

Not the exact question you're looking for?

Start a new thread and receive assistance from our community.

87k+ Posts
394 Online
Create Post

Similar threads

Similar threads

The Market Trading Game Changer

Join 2,500+ subscribers inside the useThinkScript VIP Membership Club
  • Exclusive indicators
  • Proven strategies & setups
  • Private Discord community
  • ‘Buy The Dip’ signal alerts
  • Exclusive members-only content
  • Add-ons and resources
  • 1 full year of unlimited support

Frequently Asked Questions

What is useThinkScript?

useThinkScript is the #1 community of stock market investors using indicators and other tools to power their trading strategies. Traders of all skill levels use our forums to learn about scripting and indicators, help each other, and discover new ways to gain an edge in the markets.

How do I get started?

We get it. Our forum can be intimidating, if not overwhelming. With thousands of topics, tens of thousands of posts, our community has created an incredibly deep knowledge base for stock traders. No one can ever exhaust every resource provided on our site.

If you are new, or just looking for guidance, here are some helpful links to get you started.

What are the benefits of VIP Membership?
VIP members get exclusive access to these proven and tested premium indicators: Buy the Dip, Advanced Market Moves 2.0, Take Profit, and Volatility Trading Range. In addition, VIP members get access to over 50 VIP-only custom indicators, add-ons, and strategies, private VIP-only forums, private Discord channel to discuss trades and strategies in real-time, customer support, trade alerts, and much more. Learn all about VIP membership here.
How can I access the premium indicators?
To access the premium indicators, which are plug and play ready, sign up for VIP membership here.
Back
Top