Need help anyone can help coding below requirment.
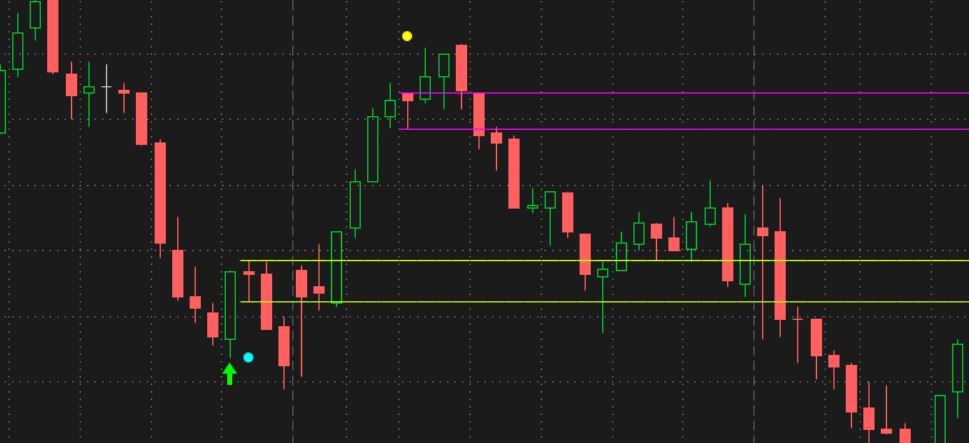
1. example 10 candle stick or certain sticks, price trend up. highest price for each stick keep make higher. until the latest highest price bar is red bar, make alert.
2. example price trending down, the lowest price keep make lower, until the latest lowest price is green bar.make alert
3. May use for 4hours chart or daily chart.
4.in a uptrend(price keeping higher and higher), if the latest bar's highest price lower than highest price(lower high) and the latest price lowest price is lower than the highest bar's lowest price(lower low) . we consier it is a top area
5. in a downtrend, if the latest bar make a "higher high" and "higher low", we conside it is a bottom area.
whether have alert or scanner can filter these signals. many thanks
or any indicator similar to it? thanks a lot.
Last edited by a moderator: