The idea is the deviations are 1.3 (65%)and 2(98%) of prices. Prices breaking into or above or below these zones (red and Green) are extended and may signal a reversal soon. There is a safe holding zone in light gray for buys and dark gray for sells. Can trade on breaks of 1.3 line or once you are in a move up or down you can hold till safe zones are exited. Threw in some arrows for all the arrow fans.
Just be careful when price closes outside the bands. Instead of reversing it may ride the bands up or down.

Code:# Enhanced Standard Deviation Bands by Horserider 9/21/2019 # Two standard TD Ameritrade IP Company, Inc. (c) 2019 StandardDeviation studies combined into one study with deviations being 1.3 and 2.0 . User changeable length, dev, and avg type to suit their trading. # # Inner bands input length = 20; input numDevDn = -1.3; input numDevUp = 1.3; input averageType = AverageType.EXPONENTIAL; def avg = MovingAverage(averageType, close); def expDev = ExpAverage(AbsValue(avg - close), length); plot UpperBand = avg + numDevUp * expDev; plot MidLine = avg; plot LowerBand = avg + numDevDn * expDev; UpperBand.SetDefaultColor(GetColor(1)); MidLine.SetDefaultColor(GetColor(1)); MidLine.SetStyle(Curve.SHORT_DASH); LowerBand.SetDefaultColor(GetColor(1)); # Outer bands input lengthob = 20; input numDevDnob = -2.0; input numDevUpob = 2.0; input averageTypeob = AverageType.EXPONENTIAL; def avgob = MovingAverage(averageTypeob, close); def expDevob = ExpAverage(AbsValue(avgob - close), lengthob); plot UpperBandob = avgob + numDevUpob * expDevob; #plot MidLineob = avgob; plot LowerBandob = avgob + numDevDnob * expDevob; UpperBandob.SetDefaultColor(GetColor(1)); #MidLineob.SetDefaultColor(GetColor(1)); #MidLineob.SetStyle(Curve.SHORT_DASH); LowerBandob.SetDefaultColor(GetColor(1)); # Clouds for safe zones Light gray for long, dark gray for short. AddCloud (midline,upperbandob, Color.lIGHT_GRAY, Color.lIGHT_GRAY); AddCloud(midline, lowerband, Color.GRAY, Color.GRAY); # Clounds for areas of possible reversals. Green for longs, red for shorts. AddCloud( upperband,upperbandob, Color.LIGHT_RED, Color.LIGHT_RED); AddCloud( lowerband,lowerbandob, Color.LIGHT_GREEN, Color.LIGHT_GREEN); # Plot arrows for close crosses of Deviation lines. Indside plum, Outside red/green Arrows included because many like arrows. I suggest being careful following any arrow signal. plot UpSignalob = close crosses below lowerbandob ; plot DownSignalob = close crosses above upperbandob; plot UpSignal = close crosses lowerband ; plot DownSignal = close crosses upperband; UpSignal.SetDefaultColor(Color.PLUM); UpSignal.SetPaintingStrategy(PaintingStrategy.BOOLEAN_ARROW_UP); DownSignal.SetDefaultColor(Color.PLUM); DownSignal.SetPaintingStrategy(PaintingStrategy.BOOLEAN_ARROW_DOWN); UpSignalob.SetDefaultColor(Color.UPTICK); UpSignalob.SetPaintingStrategy(PaintingStrategy.BOOLEAN_ARROW_UP); DownSignalob.SetDefaultColor(Color.DOWNTICK); DownSignalob.SetPaintingStrategy(PaintingStrategy.BOOLEAN_ARROW_DOWN);
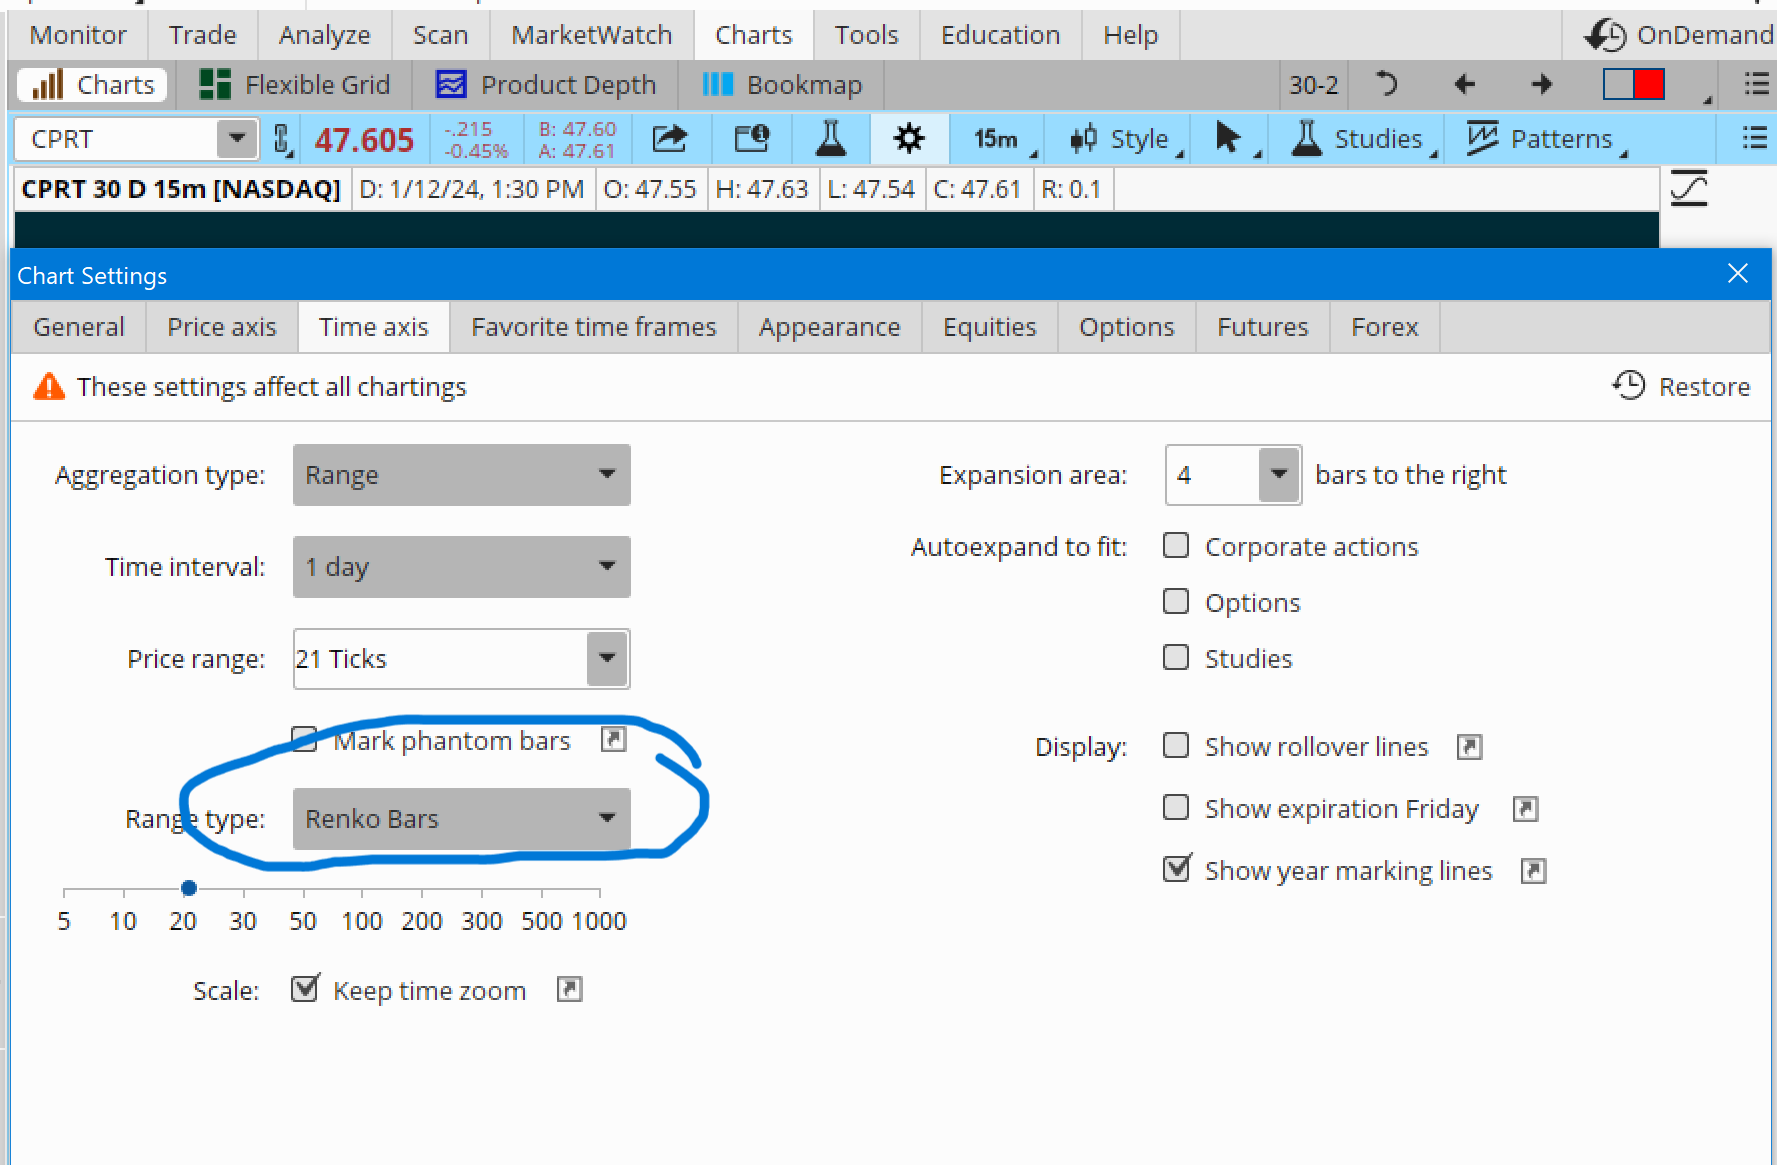
looks awesome @horserider .. does this indicator repaint? I used to use a similar strategy with TriangularMA and ATR but it repainted which wasn't ideal.. see image below.. I used renko bars with a fast MA line.. when the price crossed the middle outer band, it signaled an entry. I also used PSAR to confirm reversals. Some other indicators also if you care to discuss. I haven't been able to recreate it in TOS yet. What are your thoughts?