## OneNote Archive Name: Relative Volume to past days Average Relative Volume _v02_Mobius
## Suggested Tos Name using JQ naming convention: RelVolumeVsAvgRelVolume_v02_Mobius
## OneNote Section: Volume
## Archive Date: 02.10.2019
## Provenance: Posted by Mobius himself in the Lounge on 02.05.2019
## Archive, Usage or Lounge Notes:
# 09:18 Mobius: david -
## End OneNote Archive Header
# Relative Volume to past days Average Relative Volume
# Mobius
# Chat Room Request 01.23.2017
input length = 60;
def v = volume(period = AggregationPeriod.Day);
def active = if secondsFromTime(0930) > 0 and
secondsTillTime(1600) >= 0
then 1
else 0;
def Bars = Ceil((RegularTradingEnd(20160104) - RegularTradingStart(20160104))
/ GetAggregationPeriod());
def newDay = GetDay() != GetDay()[1];
def DayVol = if newDay
then v
else DayVol[1] + v;
def avgVolume = (fold day = 0 to length
with s
do s + GetValue(DayVol, day * Bars, (length - 1) * Bars)) / length;
plot R = DayVol / avgVolume * 100;
R.SetPaintingStrategy(PaintingStrategy.Histogram);
R.AssignValueColor(if R > 100
then color.green
else color.red);
# End Code
#From StanL Treepad database ~2014
# RCG3: Unusual volume
input price = volume;
input choice = {default increased, decreased};
input percent = 20;
input length = 50;
def avg = average(price, length)[1];
def chg = 100*(price/avg -1);
plot scan;
switch (choice) {
case increased:
scan = chg >= percent;
case decreased:
scan = chg <= -percent;
}
#end
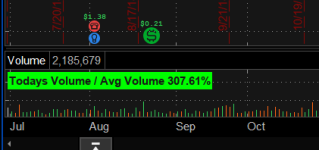
Can this be put up as a label ?@San You mean displaying them as labels on the upper chart?
#Paris in TSL on 1/15/18
# Volume Pct Relative # blt
# 10.5.2016
input length = 50;
def RelVol = volume(period = AggregationPeriod.DAY) / Average(volume(period = AggregationPeriod.DAY), length);
AddLabel(1, "Todays Volume / Avg Volume " +
AsPercent(RelVol),
if volume(period = AggregationPeriod.DAY)
> Average(volume(period =
AggregationPeriod.DAY), length)
then Color.GREEN
else Color.RED);
#End of Label Code#
You are most welcome! A little trick for you; Go into the studies beaker, open it up, and drag the study to the top if you want it at the top of the main chart.Perfect , Thank Marcos
# Comparison of Today's Volume at bar and Volume at time
# Mobius
# V01.11.02.2017
# V02.11.02.2017 Revision to display On Volume and added a histogram to overlay current volume with previous days volume.
declare On_Volume;
def v = volume;
def bar = barNumber();
def xBar = if SecondsTillTime(0930) == 0
then bar
else xBar[1];
def pxBar = if xBar != xBar[1]
then xBar[1]
else pxBar[1];
def zxBar = if SecondsFromTime(0930) >= 0 and
SecondsTillTime(1600) > 1
then 0
else if SecondsTillTime(1600) == 0
then bar
else zxBar[1];
def pzxBar = if zxBar != zxBar[1]
then zxBar[1]
else pzxBar[1];
def pxBars = if bar == xBar
then pxBar
else if bar >= xBar
then pxBars[1] + 1
else pxBars[1];
def length = bar - (pxBars-1);
def RelVol = if bar >= xBar
then getValue(v, length)
else 0;
def pVol = if bar == xBar
then 0
else if bar > xBar
then pVol[1] + RelVol
else pVol[1];
def tVol = if SecondsTillTime(0930) == 0
then v
else if SecondsFromTime(0930) > 0 and SecondsTillTime(1600) >= 0
then compoundValue(1, tVol[1] + v, v)
else tVol[1];
plot pVolHisto = if !isNaN(close) then RelVol else double.nan;
pVolHisto.SetPaintingStrategy(PaintingStrategy.Histogram);
pVolHisto.AssignValueColor(if RelVol > tVol[1]
then createColor(20,125,20)
else createColor(150,150,150));
addlabel(1, "yesterdays volume at bar = " + RelVol +
" yesterdays volume = " + pVol +
" todays volume = " + tVol,
if tVol > pVol
then color.green
else color.red);
# End Code Previous Days Volume Comparison V02
Join useThinkScript to post your question to a community of 21,000+ developers and traders.
Thread starter | Similar threads | Forum | Replies | Date |
---|---|---|---|---|
S | Trade Ideas Intraday , single bar , Relative Volume RVOL For ThinkOrSwim | Indicators | 16 | |
YungTrader's Relative Volume | Indicators | 17 | ||
A | RVOL (Relative Volume) Scan Label Watchlist for ThinkorSwim | Indicators | 218 | |
N | Relative Strength RP Labels For ThinkOrSwim | Indicators | 35 | |
ARSI - Adaptive Relative Strength Index for ThinkorSwim | Indicators | 15 |
Start a new thread and receive assistance from our community.
useThinkScript is the #1 community of stock market investors using indicators and other tools to power their trading strategies. Traders of all skill levels use our forums to learn about scripting and indicators, help each other, and discover new ways to gain an edge in the markets.
We get it. Our forum can be intimidating, if not overwhelming. With thousands of topics, tens of thousands of posts, our community has created an incredibly deep knowledge base for stock traders. No one can ever exhaust every resource provided on our site.
If you are new, or just looking for guidance, here are some helpful links to get you started.