Message from Author:
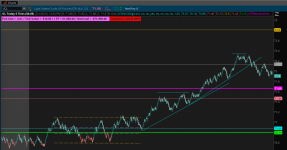
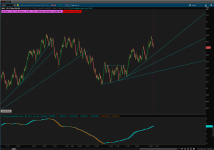
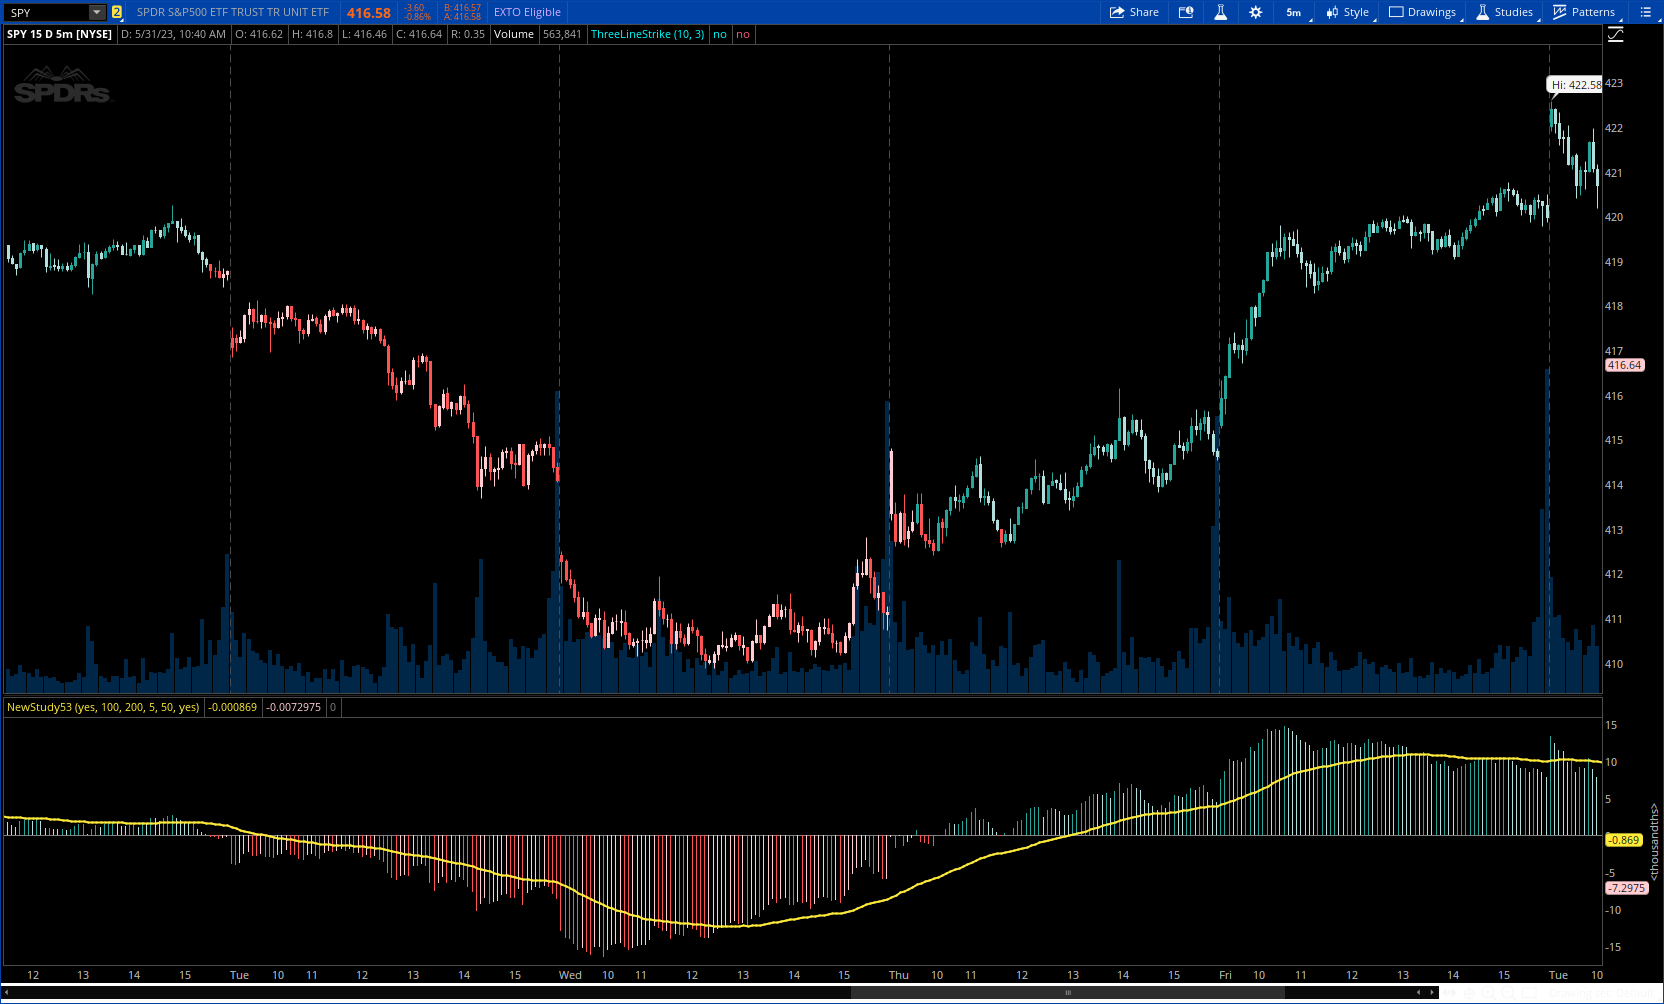
The relative difference between a moving average and the price can be a useful tool for interpreting trend direction and identifying pullbacks or breakdowns. This indicator recursively finds all the relative moving average differences between two simple moving averages of your choosing and weighs them by their lengths. It then returns a value that represents the weighted average of all the moving average differences. This can represent the gradient of motion between moving averages, or the path of least resistance, which the price may revert to in certain situations.
For the settings: minimum MA represents the minimum simple moving average to consider for the total weighted average. Maximum MA represents the maximum simple moving average to consider. "Move By" is the increment that you want to move between these two moving averages.
A positive moving average difference indicates that the price is above the moving average difference (i.e. the weighted average of all moving average differences between your two selected moving averages). A negative moving average difference indicates that the price is below the moving average difference. I have added a signal with a configurable length input as well to smooth out trends.
CODE:
CSS:
#//@wbburgin
#indicator("Recursive Moving Average Difference [wbburgin]", overlay=false, timeframe="")
# converted by Sam4Cok@Samer800    - 05/2023
declare lower;
input ColorBars = yes;
input minMaLength = 100;        # "Minimum Moving Average Length"
input maxMaLength = 200;        # "Maximum Moving Average Length"
input MoveBy = 5;               # "Move By"
input signalLength = 50;        # "Signal Length"
input ShowSignalLine = yes;     # "Show Signal"

def na = Double.NaN;
def last = isNaN(close);
#--- Color
DefineGlobalColor("grow_above" , CreateColor(38,166,154));
DefineGlobalColor("fall_above" , CreateColor(178,223,219));
DefineGlobalColor("grow_below" , CreateColor(255,205,210));
DefineGlobalColor("fall_below" , CreateColor(255,82,82));
DefineGlobalColor("Signal"     , CreateColor(255,235,59));

def masTotalLength = fold i = minMALength to maxMALength with p do
                     if  (i % MoveBy) ==0 then p + i else p;

def weightedAverage = fold i1 = minMALength to maxMALength with p1 do
                     if (i1 % MoveBy) ==0 then p1 +
                         (((close - ((fold j=0 to i1 with q do
                      q +  GetValue(close,j)) / i1)) /  close) * i1) else p1;

def wa = weightedAverage / masTotalLength;
def signal = ExpAverage(wa, signalLength);

def col = if wa > 0 then if wa > wa[1] then 2 else 1 else
          if wa > wa[1] then -1 else -2;

plot sigLine = if ShowSignalLine then signal else na;
sigLine.SetDefaultColor(GlobalColor("Signal"));
sigLine.SetLineWeight(2);

plot maDiff = wa;
maDiff.SetLineWeight(3);
maDiff.SetPaintingStrategy(PaintingStrategy.HISTOGRAM);
maDiff.AssignValueColor(if col==2 then GlobalColor("grow_above") else
                        if col==1 then GlobalColor("fall_above") else
                        if col==-1 then GlobalColor("grow_below") else GlobalColor("fall_below"));
plot zero = if last then na else 0;
zero.SetDefaultColor(Color.GRAY);
AssignPriceColor(if !ColorBars then Color.CURRENT else
                 if col==2 then GlobalColor("grow_above") else
                 if col==1 then GlobalColor("fall_above") else
                 if col==-1 then GlobalColor("grow_below") else GlobalColor("fall_below"));
#-- END of CODE")