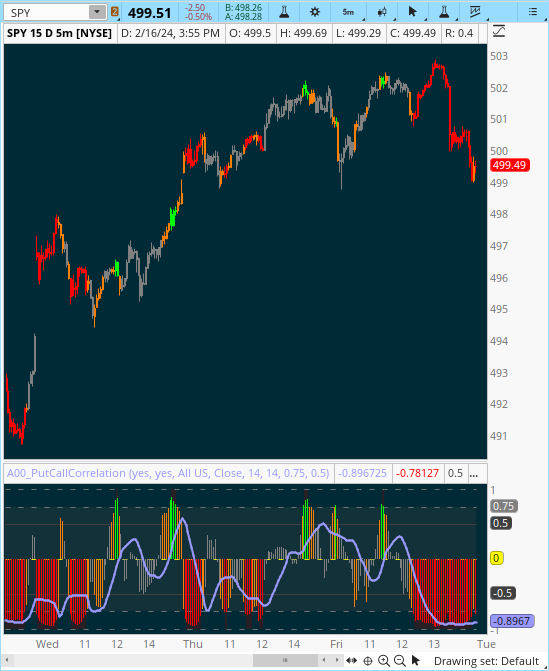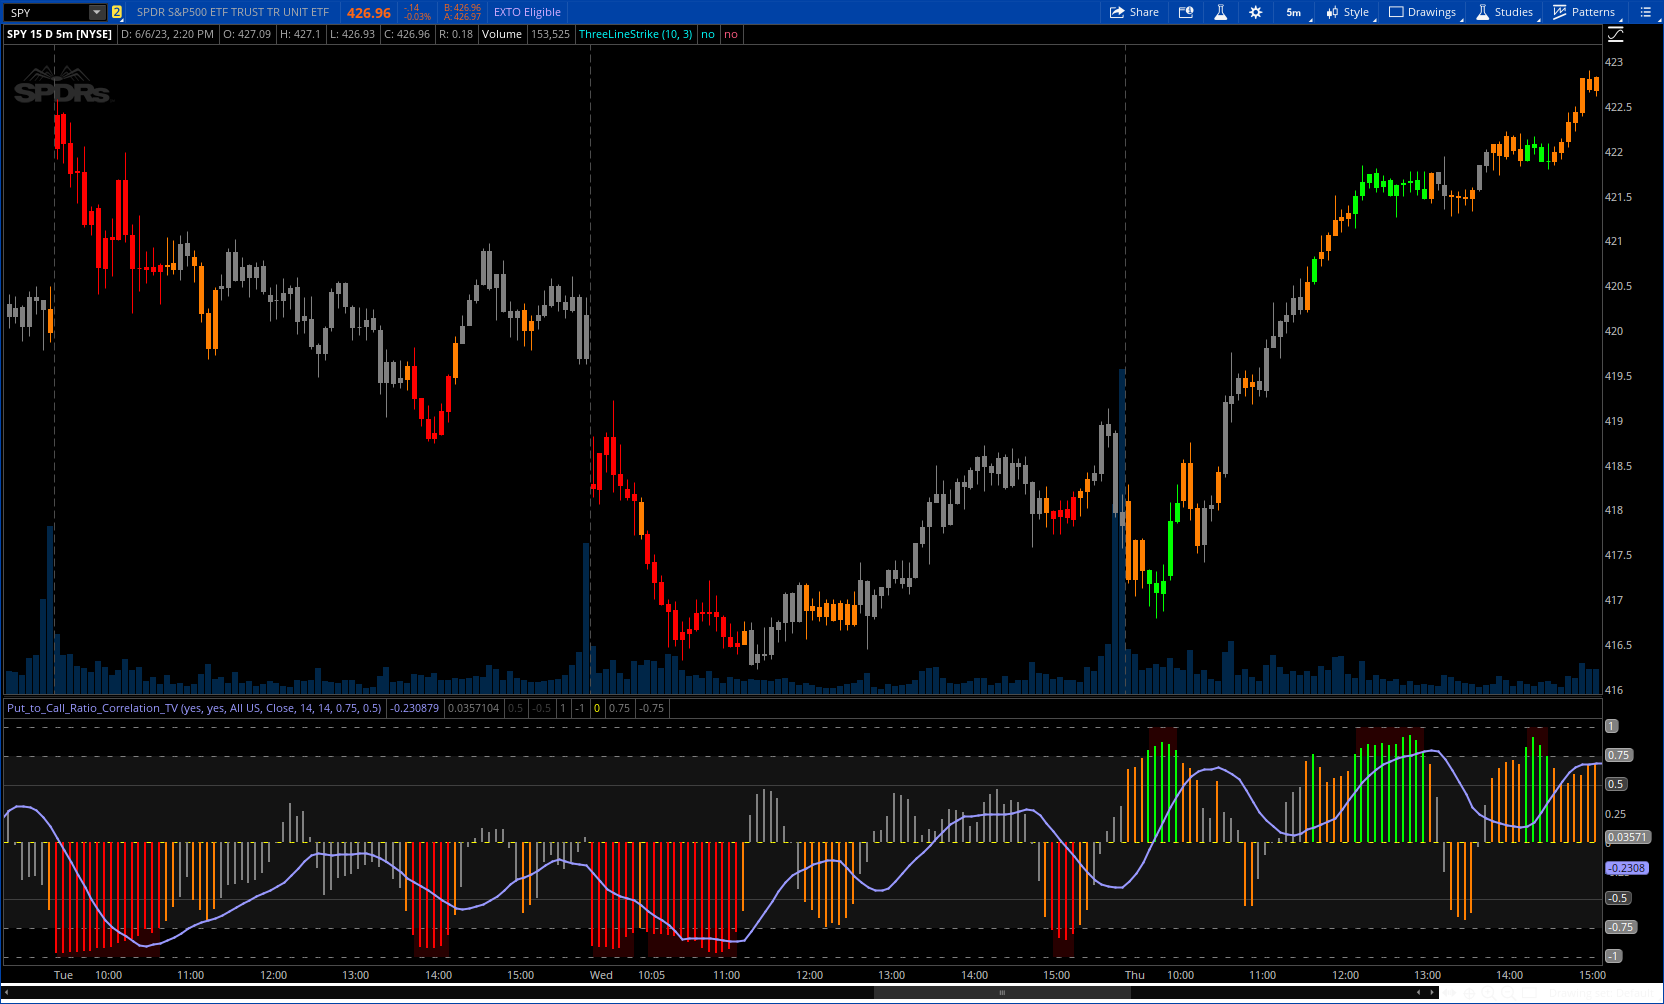
Author Message: - I added multiple symbols to select from.
check the link
https://www.tradingview.com/v/UJBQOniD/
CODE:
CSS:
# https://www.tradingview.com/v/UJBQOniD/
#// © Steversteves
#indicator("Put to Call Ratio Correlation")
# converted and mod by Sam4Cok@Samer800    - 06/2023
declare lower;
input ColorBars = yes;
input ShowSmaLine = yes;
input Market = { NYSE, NASDAQ, NASDAQ100, "S&P 500", "DOW Jones", "Russel 2000", AMEX, ARCA,default "All US"};
input source = {default "Close", "HL2", "HLC3", "OHLC4"};
input SmoothingLength = 14;    # "Smoothing length", "Smoothies the SMA of the correlation."
input CorrelationLength = 14;  # "Correlation Length","Reccomended to remain at 14"
input ThresholdExtreme = 0.75;
input ThresholdReversal = 0.5;
def na = Double.NaN;
def last = isNaN(close);
#-- Color
DefineGlobalColor("gray", Color.GRAY);# = color.gray
DefineGlobalColor("grayfill", Color.DARK_GRAY);
DefineGlobalColor("orange", Color.DARK_ORANGE);
DefineGlobalColor("red", Color.DARK_RED);
DefineGlobalColor("green", Color.GREEN);

#---
def tickC;
def tickHL2;
def tickOHLC4;
def tickHLC3;

switch (Market) {
case NASDAQ:
    tickC     = close(symbol = "$PCN/Q");
    tickHL2   = hl2  (symbol = "$PCN/Q");
    tickOHLC4 = ohlc4(symbol = "$PCN/Q");
    tickHLC3  = hlc3 (symbol = "$PCN/Q");
case NYSE:
    tickC     = close(symbol = "$PCN");
    tickHL2   = hl2  (symbol = "$PCN");
    tickOHLC4 = ohlc4(symbol = "$PCN");
    tickHLC3  = hlc3 (symbol = "$PCN");
case "Russel 2000":
    tickC     = close(symbol = "$PCRL");
    tickHL2   = hl2  (symbol = "$PCRL");
    tickOHLC4 = ohlc4(symbol = "$PCRL");
    tickHLC3  = hlc3 (symbol = "$PCRL");
case "S&P 500":
    tickC     = close(symbol = "$PCSP");
    tickHL2   = hl2  (symbol = "$PCSP");
    tickOHLC4 = ohlc4(symbol = "$PCSP");
    tickHLC3  = hlc3 (symbol = "$PCSP");
case "DOW Jones":
    tickC     = close(symbol = "$PCI");
    tickHL2   = hl2  (symbol = "$PCI");
    tickOHLC4 = ohlc4(symbol = "$PCI");
    tickHLC3  = hlc3 (symbol = "$PCI");
case AMEX:
    tickC     = close(symbol = "$PCA");
    tickHL2   = hl2  (symbol = "$PCA");
    tickOHLC4 = ohlc4(symbol = "$PCA");
    tickHLC3  = hlc3 (symbol = "$PCA");
case ARCA:
    tickC     = close(symbol = "$PCAR");
    tickHL2   = hl2  (symbol = "$PCAR");
    tickOHLC4 = ohlc4(symbol = "$PCAR");
    tickHLC3  = hlc3 (symbol = "$PCAR");
case NASDAQ100:
    tickC     = close(symbol = "$PCND");
    tickHL2   = hl2  (symbol = "$PCND");
    tickOHLC4 = ohlc4(symbol = "$PCND");
    tickHLC3  = hlc3 (symbol = "$PCND");
default:
    tickC     = close(symbol = "$PCALL");
    tickHL2   = hl2  (symbol = "$PCALL");
    tickOHLC4 = ohlc4(symbol = "$PCALL");
    tickHLC3  = hlc3 (symbol = "$PCALL");
}
def src;
switch (source) {
case "hl2":
    src     = tickHL2;
case "hlc3":
    src     = tickHLC3;
case "ohlc4":
    src     = tickOHLC4;
default:
    src     = tickC;
}

def cor = Correlation(src, close, CorrelationLength);
def sma = Average(cor, SmoothingLength);

#/ Assessments

def neutral = cor >= 0 and cor < ThresholdReversal or cor <= 0 and cor > -ThresholdReversal;
def mid     = cor >= ThresholdReversal and cor <ThresholdExtreme or cor <= -ThresholdReversal and cor >= -ThresholdExtreme;
def reversal = cor >= ThresholdExtreme;
def dnrevrsal = cor<= -ThresholdExtreme;
def negreversal = cor <= -ThresholdExtreme;
def posreversal = cor >= ThresholdExtreme;

def sentiment = if neutral then 0 else if mid then -1 else if reversal then 1 else
                if negreversal then -2 else 0;
def negcolor = negreversal;
def poscolor = posreversal;

#// plots
plot smaLine = if ShowSmaLine then sma else na;    # "SMA"
plot corHist = cor;    # "sentiment"

smaLine.SetLineWeight(2);
smaLine.SetDefaultColor(Color.VIOLET);
corHist.SetPaintingStrategy(PaintingStrategy.HISTOGRAM);
corHist.AssignValueColor(if sentiment==1 then GlobalColor("green") else
                         if sentiment==-1 then GlobalColor("orange") else
                         if sentiment==-2 then Color.RED else GlobalColor("gray"));

#// Fills
plot upperRev = if last then na else ThresholdReversal;          # "Upper Band"
plot lowerRev = if last then na else -ThresholdReversal;         # "Lower Band"
plot upperband = if last then na else 1;          # "Upper Band"
plot lowerband = if last then na else -1;         # "Lower Band"
plot centreband = if last then na else 0;         # "Centre Band"
plot lclupperband = if last then na else ThresholdExtreme;     # "Threshold Band"
plot lcllowerband = if last then na else -ThresholdExtreme;    # "Threshold Band"

upperRev.SetDefaultColor(Color.DARK_GRAY);
lowerRev.SetDefaultColor(Color.DARK_GRAY);
upperband.SetDefaultColor(Color.GRAY);
lowerband.SetDefaultColor(Color.GRAY);
centreband.SetDefaultColor(Color.YELLOW);
lclupperband.SetDefaultColor(Color.GRAY);
lcllowerband.SetDefaultColor(Color.GRAY);

upperband.SetStyle(Curve.SHORT_DASH);
lowerband.SetStyle(Curve.SHORT_DASH);
centreband.SetStyle(Curve.SHORT_DASH);
lclupperband.SetStyle(Curve.SHORT_DASH);
lcllowerband.SetStyle(Curve.SHORT_DASH);

AddCloud(lclupperband, lcllowerband, GlobalColor("grayfill"));
AddCloud(if negcolor then lcllowerband else na, lowerband, GlobalColor("red"));
AddCloud(if poscolor then upperband else na,lclupperband , GlobalColor("red"));

#// Bar colour for on chart notification of reversal areas

AssignPriceColor(if !ColorBars then Color.CURRENT else
                 if sentiment==1 then GlobalColor("green") else
                 if sentiment==-1 then GlobalColor("orange") else
                 if sentiment==-2 then Color.RED else GlobalColor("gray"));    # "Bar Colour"


#--- END of CODE
Last edited:
 CC", "", close, lookahead=barmerge.lookahead_on)