Purple Cloud For ThinkOrSwim

freedom Traders

New member
The author states:
The lines calculate several intermediate values used in the indicator's calculations. Here's a breakdown of each variable:

a1: Represents a modified Exponential Moving Average (EMA) of the high price series, subtracted by a Simple Moving Average (SMA) of the low price series.
a2: Takes the square root of the lowest value between the highest close price over the last 200 bars and the current close price, multiplied by a1.
b1: Represents a modified EMA of the low price series, subtracted by an SMA of the high price series.
b2: Takes the square root of the highest value between the lowest close price over the last 200 bars and the current close price, multiplied by b1.
c1: Represents the square root of a2 multiplied by b2.
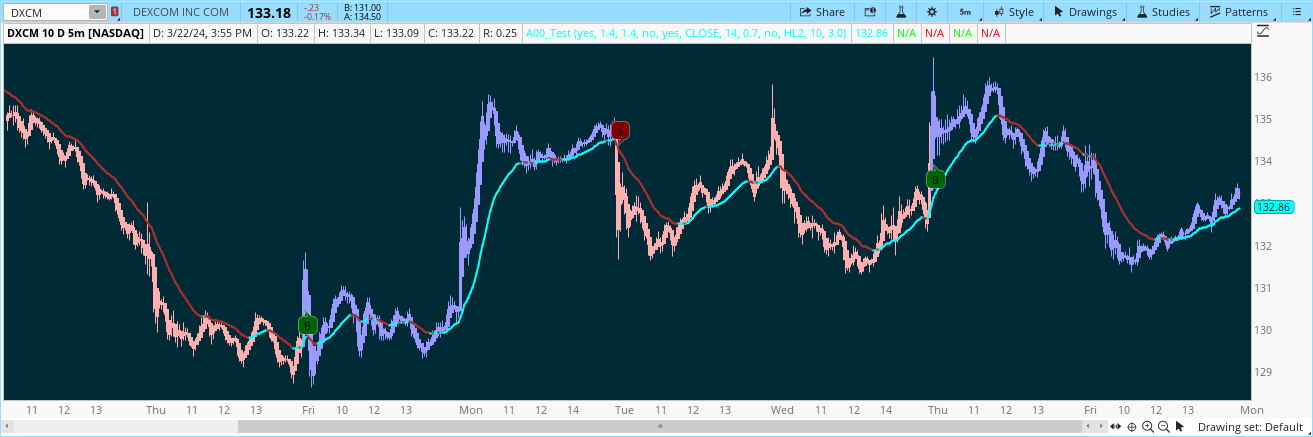
These lines create multiple plots using the plot function. Each plot represents a displaced version of c1 by a certain multiple of the Average True Range (ATR) multiplied by a constant factor (0.1, 0.2, 0.3, etc.). The transparency (transp) is set to 100 for all plots.
e3xET8Z.png


Please convert this tradingview indicator
https://www.tradingview.com/script/CcsssyQv/
to TOS script please...Purple cloud very good indicator
 
Last edited by a moderator:
Please convert this tradingview indicator
https://www.tradingview.com/script/CcsssyQv/
to TOS script please...Purple cloud very good indicator

// This source code is subject to the terms of the Mozilla Public License 2.0 at https://mozilla.org/MPL/2.0/
// © muratm82
//@version=5
indicator("Purple Cloud [MMD]",overlay=true, timeframe="", timeframe_gaps=true)


x1 = input(21, "Period")
alpha = input.float(1, "Alpha", step = 0.1)
mmdband=input(true,'MMD Bands')
x2 = ta.atr(x1) * alpha
xh = close + x2
xl = close - x2
a1=ta.vwma(hl2*volume,math.ceil(x1/4))/ta.vwma(volume,math.ceil(x1/4))
a2=ta.vwma(hl2*volume,math.ceil(x1/2))/ta.vwma(volume,math.ceil(x1/2))
a3=2*a1-a2
a4=ta.vwma(a3,x1)

b1 = 0.0
b1 := na(b1[1]) ? ta.sma(close, x1) : (b1[1] * (x1 - 1) + close) / x1

buy = a4<=xl and close>b1
sell = a4>=xh and close<b1
xs = 0
xs := buy ? 1 : sell ? -1 : xs[1]
barcolor( color = xs==1 ? color.purple :xs==-1? color.orange:na)


plotshape(buy and xs != xs[1], title = "BUY", text = 'B', style = shape.labelup, location = location.belowbar, color= color.purple, textcolor = color.white, size = size.tiny)
plotshape(sell and xs != xs[1], title = "SELL", text = 'S', style = shape.labeldown, location = location.abovebar, color= color.orange, textcolor = color.white, size = size.tiny)

xx1 = if close < open
low
else
high
xx2 = if close[1] < open[1]
low[1]
else
high[1]
xx3 = if close[2] < open[2]
low[2]
else
high[2]
xx4 = if close[3] < open[3]
low[3]
else
high[3]
xx5 = if close[4] < open[4]
low[4]
else
high[4]
xx6 = if close[5] < open[5]
low[5]
else
high[5]
xx7 = if close[6] < open[6]
low[6]
else
high[6]
xx8 = if close[7] < open[7]
low[7]
else
high[7]
xx9 = if close[8] < open[8]
low[8]
else
high[8]
xx10 = if close[9] < open[9]
low[9]
else
high[9]
xx11 = if close[10] < open[10]
low[10]
else
high[10]

xx12 = if close[11] < open[11]
low[11]
else
high[11]
xx13 = if close[12] < open[12]
low[12]
else
high[12]
xx14 = if close[13] < open[13]
low[13]
else
high[13]
xx15 = if close[14] < open[14]
low[14]
else
high[14]
xx16 = if close[15] < open[15]
low[15]
else
high[15]
y1=(xx1+xx2+xx3+xx4+xx5+xx6+xx7+xx8+xx9+xx10+xx11+xx12+xx13+xx14+xx15+xx16)/16
aa=2*ta.ema(y1,2)-ta.ema(y1,4)
aa1=ta.highest(high,16)
aa2=ta.lowest(low,16)
aa3=(aa1-aa2)*0.618
plot(aa+aa3,color=mmdband?color.purple:na,transp=40)
plot(aa-aa3,color=mmdband?color.orange:na,transp=40)
plot(aa,color=mmdband?color.black:na,transp=40)

alertcondition(buy and xs != xs[1], "PC Long", "PC Long")
alertcondition(sell and xs != xs[1], "PC Short", "PC Short")
check the below:

CSS:
#// This source code is subject to the terms of the Mozilla Public License 2.0 at https://mozilla.org/MPL/2.0/
#// © muratm82
#indicator("Purple Cloud [MMD]",overlay=true, timeframe="", timeframe_gaps=true)
# Converted and mod by Sam4Cok@Samer800    - 12/2023

input colorBars = yes;
input BuyingPressureThreshold = 1.40; #,"Buying Pressure Threshold %", step = 0.1)
input SellingPressureThreshold = 1.40; #,"Selling Pressure Threshold %", step = 0.1)
input wicks = no;
input showTrendLine = yes;
input trendSource = close;
input trendPeriod = 14;            # "Period"
input trendAtrFactor = 0.70;       # "Alpha"
input showSupertrend = no;
input SupertrendSource = hl2;
input SupertrendAtrPeriod = 10;     # "Supertrend ATR Length"
input SupertrendFactor = 3.0;       # "Supertrend Factor"


def na = Double.NaN;
#vwma(source, length)
script VWMA {
    input src = close;
    input len = 14;
    input vol = volume;
    def nom = Average(src * vol, len);
    def den = Average(vol, len);
    def VWMA = nom / den;
    plot result = VWMA;
}
script SuperTrend {
    input src = hl2;
    input factor = 3;
    input atrLength = 10;
    input wicks = no;
    def atr = factor * ATR(Length = atrLength);
    def highPrice = if wicks then high else close;
    def lowPrice  = if wicks then low else close;
    def doji4price = open == close and open == low and open == high;
    def trend = {default init, long, short};
    def longStop;
    def up = src - atr;
    def longStopPrev;
    def shortStop;
    def dn = src + atr;
    def shortStopPrev;
    switch (trend[1]) {
    case init:
        trend = trend.long;
        longStop  = up;
        longStopPrev = longStop;
        shortStop = dn;
        shortStopPrev = shortStop;
    case long:
        longStopPrev = longStop[1];
        shortStop = dn;
        shortStopPrev = shortStop[1];
        if (longStop[1] > 0) {
            if doji4price {
                longStop = longStopPrev;
            } else if lowPrice[1] > longStopPrev {
                longStop = Max(up, longStopPrev);
            }  else {
                longStop = up;
            }
        } else {
            longStop = longStopPrev;
        }
        trend = if lowPrice < longStopPrev then trend.short else trend.long;
    case short:
        longStop = up;
        longStopPrev = longStop[1];
        shortStopPrev = shortStop[1];
        if (shortStop[1] > 0) {
            if doji4price {
                shortStop = shortStopPrev;
            } else if highPrice[1] < shortStopPrev {
                shortStop = Min(dn, shortStopPrev);
            } else {
                shortStop = dn;
            }
        } else {
            shortStop = shortStopPrev;
        }
        trend = if highPrice > shortStopPrev then trend.long else trend.short;
}
    def long = trend == trend.long;
    def short = trend == trend.short;
    def direction = if short then -1 else 1;
    def superTrend = if direction < 0 then shortStop else longStop;
    plot ST = superTrend;
    plot dir = direction;
}
def supertrend = SuperTrend(SupertrendSource, SupertrendFactor, SupertrendAtrPeriod, wicks).ST;
def direction  = SuperTrend(SupertrendSource, SupertrendFactor, SupertrendAtrPeriod, wicks).DIR;

def x2 = ATR(LENGTH = trendPeriod) * trendAtrFactor;
def xh = trendSource + x2;
def xl = trendSource - x2;
def a1 = vwma(SupertrendSource * volume, Ceil(trendPeriod / 4)) / vwma(volume, Ceil(trendPeriod / 4));
def a2 = vwma(SupertrendSource * volume, Ceil(trendPeriod / 2)) / vwma(volume, Ceil(trendPeriod / 2));
def a3 = 2 * a1 - a2;
def a4 = vwma(a3, trendPeriod);
def b1 = CompoundValue(1,(b1[1]*(trendPeriod - 1) + trendSource)/trendPeriod, Average(trendSource,trendPeriod));
def a5 = 2 * a4 * b1 / (a4 + b1);
def buy  = a5 <= xl and trendSource > b1 * (1 + BuyingPressureThreshold * 0.01);
def sell = a5 >= xh and trendSource < b1 * (1 - SellingPressureThreshold * 0.01);
def xs = if buy then 1 else if sell then -1 else xs[1];

def long = showSupertrend and direction > 0;
def short = showSupertrend and direction < 0;
def buySignal =  long and !long[1];
def sellSignal = short and !short[1];

plot trendLine = if showTrendLine then b1 else na;
trendLine.SetLineWeight(2);
trendLine.AssignValueColor(if b1>b1[1] then Color.CYAN else
                           if b1<b1[1] then Color.DOWNTICK else Color.GRAY);

plot longStopPlot  = if long then supertrend else na;
plot shortStopPlot = if short then supertrend else na;
longStopPlot.SetDefaultColor(Color.GREEN);
shortStopPlot.SetDefaultColor(Color.RED);

plot longStart = if buySignal then supertrend else na;
plot shortStart = if sellSignal then supertrend else na;
longStart.SetLineWeight(2);
shortStart.SetLineWeight(2);
longStart.SetPaintingStrategy(PaintingStrategy.POINTS);
shortStart.SetPaintingStrategy(PaintingStrategy.POINTS);
longStart.SetDefaultColor(Color.GREEN);
shortStart.SetDefaultColor(Color.RED);

AddCloud(shortStopPlot, ohlc4, Color.DARK_RED);
AddCloud(ohlc4, longStopPlot, Color.DARK_GREEN);

AssignPriceColor(if !colorBars then Color.CURRENT else
                 if xs == 1 then Color.VIOLET else if xs == -1 then Color.PINK else Color.GRAY);


AddChartBubble(buy and xs != xs[1], low, if direction < 0 then "B+" else "B",
               if direction < 0 then Color.GREEN else Color.DARK_GREEN, no);
AddChartBubble(sell and xs != xs[1], high, if direction > 0 then "S+" else "S",
               if direction > 0 then Color.RED else Color.DARK_RED);

#-- END of CODE
@samer800 great job like always, do you think it is possible to create a SCAN for it? thank you in advance
 
+1 on the scanner @samer800. I could put 10 stocks on a chart with the indicator and watch them daily, but getting an alert would make it so much more efficient. Thanks for converting and keep up the good work!
 
+1 on the scanner @samer800. I could put 10 stocks on a chart with the indicator and watch them daily, but getting an alert would make it so much more efficient. Thanks for converting and keep up the good work!
for alerts, add the below at the end of the code.

CSS:
input sound    = Sound.NoSound;
input alertType = Alert.BAR;

Alert(buy  and xs != xs[1], "PC Long", alertType, sound);
Alert(sell and xs != xs[1], "PC Short", alertType, sound);
 
@samer800 great job like always, do you think it is possible to create a SCAN for it? thank you in advance
for scanner use the below. select Buy or sell signal scan by remove/add the "#"

CSS:
#// This source code is subject to the terms of the Mozilla Public License 2.0 at https://mozilla.org/MPL/2.0/
#// © muratm82
#indicator("Purple Cloud [MMD]",overlay=true, timeframe="", timeframe_gaps=true)
# Converted and mod by Sam4Cok@Samer800    - 12/2023

input colorBars = yes;
input BuyingPressureThreshold = 1.40; #,"Buying Pressure Threshold %", step = 0.1)
input SellingPressureThreshold = 1.40; #,"Selling Pressure Threshold %", step = 0.1)
input wicks = no;
input showTrendLine = yes;
input trendSource = close;
input trendPeriod = 14;            # "Period"
input trendAtrFactor = 0.70;       # "Alpha"
input showSupertrend = no;
input SupertrendSource = hl2;
input SupertrendAtrPeriod = 10;     # "Supertrend ATR Length"
input SupertrendFactor = 3.0;       # "Supertrend Factor"


def na = Double.NaN;
#vwma(source, length)
script VWMA {
    input src = close;
    input len = 14;
    input vol = volume;
    def nom = Average(src * vol, len);
    def den = Average(vol, len);
    def VWMA = nom / den;
    plot result = VWMA;
}
#pine_supertrend(src, factor, atrPeriod) =>
script SuperTrend {
    input src = hl2;
    input factor = 3;
    input atrLength = 10;
    input wicks = no;
    def atr = ATR(Length = atrLength);
    def highPrice = if wicks then high else close;
    def lowPrice  = if wicks then low else close;
    def up = src + atr * factor;
    def dn = src - atr * factor;
    def lowerBand;
    def upperBand;
    def up1 = if (IsNaN(upperBand[1]) or upperBand[1] == 0) then up else upperBand[1];
    def dn1 = if (IsNaN(lowerBand[1]) or lowerBand[1] == 0) then dn else lowerBand[1];
    upperBand = if (up < up1) or (highPrice[1] > up1) then up else up1;
    lowerBand = if (dn > dn1) or (lowPrice[1] < dn1) then dn else dn1;
    def trend;# = na
    def superTrend;# = na
    def prevSuperTrend = If superTrend[1] then superTrend[1] else up1;
    if (!prevSuperTrend) {
        trend = 1;
    } else
    if prevSuperTrend == up1 {
        trend = if highPrice > upperBand then -1 else 1;
    } else {
        trend = if lowPrice < lowerBand then  1 else -1;
    }
    superTrend = if trend == -1 then lowerBand else upperBand;
    plot ST = superTrend;
    plot dir = trend;
}

def supertrend = SuperTrend(SupertrendSource, SupertrendFactor, SupertrendAtrPeriod, wicks).ST;
def direction  = SuperTrend(SupertrendSource, SupertrendFactor, SupertrendAtrPeriod, wicks).DIR;
def srcVol = SupertrendSource * volume;
def Ceil4 = Ceil(trendPeriod / 4);
def Ceil2 = Ceil(trendPeriod / 2);
def x2 = ATR(LENGTH = trendPeriod) * trendAtrFactor;
def xh = trendSource + x2;
def xl = trendSource - x2;
def a1 = vwma(srcVol, Ceil4) / vwma(volume, Ceil4);
def a2 = vwma(srcVol, Ceil2) / vwma(volume, Ceil2);
def a3 = 2 * a1 - a2;
def a4 = vwma(a3, trendPeriod);
def avgTrnd = Average(trendSource,trendPeriod);
def b1 = CompoundValue(1,(b1[1]*(trendPeriod - 1) + trendSource)/trendPeriod, avgTrnd);
def a5 = 2 * a4 * b1 / (a4 + b1);
def buy  = a5 <= xl and trendSource > b1 * (1 + BuyingPressureThreshold * 0.01);
def sell = a5 >= xh and trendSource < b1 * (1 - SellingPressureThreshold * 0.01);
def xs = if buy then 1 else if sell then -1 else xs[1];

plot longSig = buy and xs != xs[1] within 3 bars;
#plot shortSig = sell and xs != xs[1] within 3 bars;


#-- END of CODE
new to this , wondering how to use scanner above to scan for stocks that provide buy signal for daily chart. any help would be appreciated.

where in script do I select Buy or sell signal scan by remove/add the "#". and will this script alert to buy signals for all stocks ?
 

Join useThinkScript to post your question to a community of 21,000+ developers and traders.

Similar threads

Not the exact question you're looking for?

Start a new thread and receive assistance from our community.

87k+ Posts
325 Online
Create Post

Similar threads

Similar threads

The Market Trading Game Changer

Join 2,500+ subscribers inside the useThinkScript VIP Membership Club
  • Exclusive indicators
  • Proven strategies & setups
  • Private Discord community
  • ‘Buy The Dip’ signal alerts
  • Exclusive members-only content
  • Add-ons and resources
  • 1 full year of unlimited support

Frequently Asked Questions

What is useThinkScript?

useThinkScript is the #1 community of stock market investors using indicators and other tools to power their trading strategies. Traders of all skill levels use our forums to learn about scripting and indicators, help each other, and discover new ways to gain an edge in the markets.

How do I get started?

We get it. Our forum can be intimidating, if not overwhelming. With thousands of topics, tens of thousands of posts, our community has created an incredibly deep knowledge base for stock traders. No one can ever exhaust every resource provided on our site.

If you are new, or just looking for guidance, here are some helpful links to get you started.

What are the benefits of VIP Membership?
VIP members get exclusive access to these proven and tested premium indicators: Buy the Dip, Advanced Market Moves 2.0, Take Profit, and Volatility Trading Range. In addition, VIP members get access to over 50 VIP-only custom indicators, add-ons, and strategies, private VIP-only forums, private Discord channel to discuss trades and strategies in real-time, customer support, trade alerts, and much more. Learn all about VIP membership here.
How can I access the premium indicators?
To access the premium indicators, which are plug and play ready, sign up for VIP membership here.
Back
Top