Price Volume Divergence Indicator for ThinkorSwim

BenTen

Administrative
Staff member
Staff
VIP
Lifetime
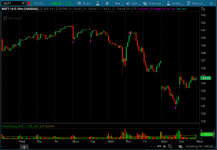
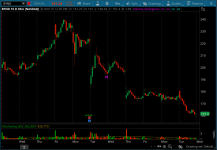
This indicator shows divergences between price and volume.
  • Bullish Volume Divergence: When the price is falling while volume continues to rises.
  • Bearish Volume Divergence: A bearish divergence signal occurs when the price is increasing while volume is decreasing.
There are two different types of signals
  • bear3 and bull3 = divergence signals within the last 3 candlesticks or bars
  • bull4 and bear4 = divergences within the last 4 candlesticks or bars
I also included alerts for these reversal signals so you can get alerted for when a new divergence is formed.

qF1Tywp.png

mSE3jZc.png


thinkScript Code

Code:
# Price Volume Divergence Indicator for ThinkorSwim
# Based on the framework of Trend Exhaustion Indicator
# Assembled by BenTen at useThinkScript.com

# 3 Bars Bearish Divergence
def bearish4 = (CLOSE > CLOSE[1] AND CLOSE [1] > CLOSE [2] AND CLOSE [2] > CLOSE [3] AND VOLUMEAVG(LENGTH = 20) < VOLUMEAVG(LENGTH = 20)[1] AND VOLUMEAVG(LENGTH = 20)[1] < VOLUMEAVG(LENGTH = 20)[2] AND VOLUMEAVG(LENGTH = 20)[2] < VOLUMEAVG(LENGTH = 20)[3]);
plot bear3 = bearish4;
bear3.AssignValueColor(Color.MAGENTA);
bear3.SetPaintingStrategy(PaintingStrategy.BOOLEAN_ARROW_DOWN);

# 3 Bars Bullish Divergence
def bullish4 = (CLOSE < CLOSE[1] AND CLOSE [1] < CLOSE [2] AND CLOSE [2] < CLOSE [3] AND VOLUMEAVG(LENGTH = 20) > VOLUMEAVG(LENGTH = 20)[1] AND VOLUMEAVG(LENGTH = 20)[1] > VOLUMEAVG(LENGTH = 20)[2] AND VOLUMEAVG(LENGTH = 20)[2] > VOLUMEAVG(LENGTH = 20)[3]);
plot bull3 = bullish4;
bull3.AssignValueColor(Color.MAGENTA);
bull3.SetPaintingStrategy(PaintingStrategy.BOOLEAN_ARROW_UP);

# 4 Bars Bearish Divergence
def bearish5 = (CLOSE > CLOSE[1] AND CLOSE [1] > CLOSE [2] AND CLOSE [2] > CLOSE [3] AND CLOSE [3] > CLOSE [4] AND VOLUMEAVG(LENGTH = 20) < VOLUMEAVG(LENGTH = 20)[1] AND VOLUMEAVG(LENGTH = 20)[1] < VOLUMEAVG(LENGTH = 20)[2] AND VOLUMEAVG(LENGTH = 20)[2] < VOLUMEAVG(LENGTH = 20)[3] and VOLUMEAVG(LENGTH = 20)[3] < VOLUMEAVG(LENGTH = 20)[4]);
plot bear4 = bearish5;
bear4.AssignValueColor(Color.CYAN);
bear4.SetPaintingStrategy(PaintingStrategy.BOOLEAN_ARROW_DOWN);

# 4 Bars Bullish Divergence
def bullish5 = (CLOSE < CLOSE[1] AND CLOSE [1] < CLOSE [2] AND CLOSE [2] < CLOSE [3] AND CLOSE [3] < CLOSE [4] AND VOLUMEAVG(LENGTH = 20) > VOLUMEAVG(LENGTH = 20)[1] AND VOLUMEAVG(LENGTH = 20)[1] > VOLUMEAVG(LENGTH = 20)[2] AND VOLUMEAVG(LENGTH = 20)[2] > VOLUMEAVG(LENGTH = 20)[3] and VOLUMEAVG(LENGTH = 20)[3] > VOLUMEAVG(LENGTH = 20)[4]);
plot bull4 = bullish5;
bull4.AssignValueColor(Color.CYAN);
bull4.SetPaintingStrategy(PaintingStrategy.BOOLEAN_ARROW_UP);

# Alerts
Alert(bull3, " ", Alert.Bar, Sound.Chimes);
Alert(bear3, " ", Alert.Bar, Sound.Chimes);
Alert(bull4, " ", Alert.Bar, Sound.Bell);
Alert(bear4, " ", Alert.Bar, Sound.Bell);

Shareable Link

https://tos.mx/uP5aTz
 

Attachments

  • qF1Tywp.png
    qF1Tywp.png
    87.5 KB · Views: 294
  • mSE3jZc.png
    mSE3jZc.png
    82.9 KB · Views: 317
Last edited:

Join useThinkScript to post your question to a community of 21,000+ developers and traders.

I found this indicator, though. Give it a try.

Code:
# Price Volume Divergence
# Mobius
# Chat Room Request 09.10.2014

declare lower;

def price = close;
def vol = volume;

script Scale {
    input c = close;
    input Min = .01;
    input Max =   1;
    def hh = HighestAll(c);
    def ll   = LowestAll(c);
    plot Range = (((Max - Min) * (c - ll)) /  (hh - ll)) + Min;
}

plot NormPrice = Scale(c = price).Range;
NormPrice.SetDefaultColor(Color.Green);
plot NormVolume = Scale(c = vol).Range;
NormVolume.SetDefaultColor(Color.Red);
plot mean = if isNaN(close) then Double.NaN else .5;
mean.SetDefaultColor(Color.White);

def cond1 = normprice < mean;
def cond2 = normprice > mean;

def cond3 = normvolume < mean;
def cond4 = normvolume > mean;

addlabel(cond1, "Negative Price Convergence", color.red);
addlabel(cond2, "Positive Price Convergence", color.green);

addlabel(cond3, "Negative Volume Convergence", color.red);
addlabel(cond4, "Positive Volume Convergence", color.green);

addlabel(normprice > 0.9, "Price overbought", color.red);
addlabel(normprice < 0.1, "Price oversold", color.green);
 
There have been a couple times where I get an audible alert that divergence has occurred but no arrow. Has anyone else run into this issue?
 
@tomsk
also when volume increasing stock can go any side up to down
can we define condition if vol increase and price increase then Green color and
Volume increasing and price going down red color
and we can scan this thing any idea how we do that.
 
@tomsk
also when volume increasing stock can go any side up to down
can we define condition if vol increase and price increase then Green color and
Volume increasing and price going down red color
and we can scan this thing any idea how we do that.
See the first post
 
I found this indicator, though. Give it a try.

Code:
# Price Volume Divergence
# Mobius
# Chat Room Request 09.10.2014

declare lower;

def price = close;
def vol = volume;

script Scale {
    input c = close;
    input Min = .01;
    input Max =   1;
    def hh = HighestAll(c);
    def ll   = LowestAll(c);
    plot Range = (((Max - Min) * (c - ll)) /  (hh - ll)) + Min;
}

plot NormPrice = Scale(c = price).Range;
NormPrice.SetDefaultColor(Color.Green);
plot NormVolume = Scale(c = vol).Range;
NormVolume.SetDefaultColor(Color.Red);
plot mean = if isNaN(close) then Double.NaN else .5;
mean.SetDefaultColor(Color.White);

def cond1 = normprice < mean;
def cond2 = normprice > mean;

def cond3 = normvolume < mean;
def cond4 = normvolume > mean;

addlabel(cond1, "Negative Price Convergence", color.red);
addlabel(cond2, "Positive Price Convergence", color.green);

addlabel(cond3, "Negative Volume Convergence", color.red);
addlabel(cond4, "Positive Volume Convergence", color.green);

addlabel(normprice > 0.9, "Price overbought", color.red);
addlabel(normprice < 0.1, "Price oversold", color.green);
Whats the difference between this and the one from post #1?
 
The second indicator is pretty nice.

Green Line (Normalized Price - NormPrice):​

  1. Above 0.5: Indicates "Positive Price Convergence," suggesting upward momentum in price.
  2. Below 0.5: Indicates "Negative Price Convergence," suggesting downward momentum in price.
  3. Above 0.9: Labeled as "Price overbought," suggesting that the asset may be overvalued and could be due for a correction.
  4. Below 0.1: Labeled as "Price oversold," suggesting that the asset may be undervalued and could be due for a rebound.

Red Line (Normalized Volume - NormVolume):​

  1. Above 0.5: Indicates "Positive Volume Convergence," suggesting that the volume is supporting the current price trend.
  2. Below 0.5: Indicates "Negative Volume Convergence," suggesting that the volume is not supporting the current price trend.

Combined Interpretation:​

  • Both Lines Above 0.5: Both price and volume are showing positive convergence, which could indicate a strong upward trend.
  • Both Lines Below 0.5: Both price and volume are showing negative convergence, which could indicate a strong downward trend.
  • Green Above 0.5, Red Below 0.5: Price is moving up, but volume is not supporting it, which could indicate a potential reversal.
  • Green Below 0.5, Red Above 0.5: Price is moving down, but volume is not supporting it, which could also indicate a potential reversal.
 
I modified the code to add visual aids:
# Price Volume Divergence
# Mobius
# Chat Room Request 09.10.2014

declare lower;

def price = close;
def vol = volume;

script Scale {
input c = close;
input Min = .01;
input Max = 1;
def hh = HighestAll(c);
def ll = LowestAll(c);
plot Range = (((Max - Min) * (c - ll)) / (hh - ll)) + Min;
}

plot NormPrice = Scale(c = price).Range;
NormPrice.SetDefaultColor(Color.Green);
plot NormVolume = Scale(c = vol).Range;
NormVolume.SetDefaultColor(Color.Red);
plot mean = if isNaN(close) then Double.NaN else .5;
mean.SetDefaultColor(Color.White);

# Draw Horizontal Lines
plot line_01 = 0.1;
line_01.SetDefaultColor(Color.GREEN);
line_01.HideTitle();
line_01.HideBubble();
line_01.SetLineWeight(1);

plot line_05 = 0.5;
line_05.SetDefaultColor(Color.WHITE);
line_05.HideTitle();
line_05.HideBubble();
line_05.SetLineWeight(1);

plot line_09 = 0.9;
line_09.SetDefaultColor(Color.RED);
line_09.HideTitle();
line_09.HideBubble();
line_09.SetLineWeight(1);

def cond1 = normprice < mean;
def cond2 = normprice > mean;

def cond3 = normvolume < mean;
def cond4 = normvolume > mean;

addlabel(cond1, "Negative Price Convergence", color.red);
addlabel(cond2, "Positive Price Convergence", color.green);

addlabel(cond3, "Negative Volume Convergence", color.red);
addlabel(cond4, "Positive Volume Convergence", color.green);

addlabel(normprice > 0.9, "Price overbought", color.red);
addlabel(normprice < 0.1, "Price oversold", color.green);

When I use this indicator, the plots change as I change the time length. For example, when looking at a stock (RTX) on a daily 1-month chart, the lines are in one position. When I change the chart to a daily 6-month view, the lines (and values of the lines) change. Is this due to the use of the HighestAll( ) function in the normalization script?
 
When I use this indicator, the plots change as I change the time length. For example, when looking at a stock (RTX) on a daily 1-month chart, the lines are in one position. When I change the chart to a daily 6-month view, the lines (and values of the lines) change. Is this due to the use of the HighestAll( ) function in the normalization script?
Yes, you are correct. HighestAll() function makes its calculations on the total number of charts available on the chart.
https://tlc.thinkorswim.com/center/reference/thinkScript/Functions/Tech-Analysis/HighestAll

Additionally, Schwab has decided to no longer update HighestAll in real time.
read more:
https://usethinkscript.com/threads/...in-real-time-in-thinkorswim.8794/#post-116082
 

Similar threads

Not the exact question you're looking for?

Start a new thread and receive assistance from our community.

87k+ Posts
304 Online
Create Post

Similar threads

Similar threads

The Market Trading Game Changer

Join 2,500+ subscribers inside the useThinkScript VIP Membership Club
  • Exclusive indicators
  • Proven strategies & setups
  • Private Discord community
  • ‘Buy The Dip’ signal alerts
  • Exclusive members-only content
  • Add-ons and resources
  • 1 full year of unlimited support

Frequently Asked Questions

What is useThinkScript?

useThinkScript is the #1 community of stock market investors using indicators and other tools to power their trading strategies. Traders of all skill levels use our forums to learn about scripting and indicators, help each other, and discover new ways to gain an edge in the markets.

How do I get started?

We get it. Our forum can be intimidating, if not overwhelming. With thousands of topics, tens of thousands of posts, our community has created an incredibly deep knowledge base for stock traders. No one can ever exhaust every resource provided on our site.

If you are new, or just looking for guidance, here are some helpful links to get you started.

What are the benefits of VIP Membership?
VIP members get exclusive access to these proven and tested premium indicators: Buy the Dip, Advanced Market Moves 2.0, Take Profit, and Volatility Trading Range. In addition, VIP members get access to over 50 VIP-only custom indicators, add-ons, and strategies, private VIP-only forums, private Discord channel to discuss trades and strategies in real-time, customer support, trade alerts, and much more. Learn all about VIP membership here.
How can I access the premium indicators?
To access the premium indicators, which are plug and play ready, sign up for VIP membership here.
Back
Top