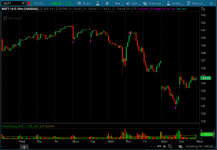
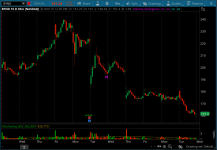
This indicator shows divergences between price and volume.


- Bullish Volume Divergence: When the price is falling while volume continues to rises.
- Bearish Volume Divergence: A bearish divergence signal occurs when the price is increasing while volume is decreasing.
- bear3 and bull3 = divergence signals within the last 3 candlesticks or bars
- bull4 and bear4 = divergences within the last 4 candlesticks or bars
thinkScript Code
Code:
# Price Volume Divergence Indicator for ThinkorSwim
# Based on the framework of Trend Exhaustion Indicator
# Assembled by BenTen at useThinkScript.com

# 3 Bars Bearish Divergence
def bearish4 = (CLOSE > CLOSE[1] AND CLOSE [1] > CLOSE [2] AND CLOSE [2] > CLOSE [3] AND VOLUMEAVG(LENGTH = 20) < VOLUMEAVG(LENGTH = 20)[1] AND VOLUMEAVG(LENGTH = 20)[1] < VOLUMEAVG(LENGTH = 20)[2] AND VOLUMEAVG(LENGTH = 20)[2] < VOLUMEAVG(LENGTH = 20)[3]);
plot bear3 = bearish4;
bear3.AssignValueColor(Color.MAGENTA);
bear3.SetPaintingStrategy(PaintingStrategy.BOOLEAN_ARROW_DOWN);

# 3 Bars Bullish Divergence
def bullish4 = (CLOSE < CLOSE[1] AND CLOSE [1] < CLOSE [2] AND CLOSE [2] < CLOSE [3] AND VOLUMEAVG(LENGTH = 20) > VOLUMEAVG(LENGTH = 20)[1] AND VOLUMEAVG(LENGTH = 20)[1] > VOLUMEAVG(LENGTH = 20)[2] AND VOLUMEAVG(LENGTH = 20)[2] > VOLUMEAVG(LENGTH = 20)[3]);
plot bull3 = bullish4;
bull3.AssignValueColor(Color.MAGENTA);
bull3.SetPaintingStrategy(PaintingStrategy.BOOLEAN_ARROW_UP);

# 4 Bars Bearish Divergence
def bearish5 = (CLOSE > CLOSE[1] AND CLOSE [1] > CLOSE [2] AND CLOSE [2] > CLOSE [3] AND CLOSE [3] > CLOSE [4] AND VOLUMEAVG(LENGTH = 20) < VOLUMEAVG(LENGTH = 20)[1] AND VOLUMEAVG(LENGTH = 20)[1] < VOLUMEAVG(LENGTH = 20)[2] AND VOLUMEAVG(LENGTH = 20)[2] < VOLUMEAVG(LENGTH = 20)[3] and VOLUMEAVG(LENGTH = 20)[3] < VOLUMEAVG(LENGTH = 20)[4]);
plot bear4 = bearish5;
bear4.AssignValueColor(Color.CYAN);
bear4.SetPaintingStrategy(PaintingStrategy.BOOLEAN_ARROW_DOWN);

# 4 Bars Bullish Divergence
def bullish5 = (CLOSE < CLOSE[1] AND CLOSE [1] < CLOSE [2] AND CLOSE [2] < CLOSE [3] AND CLOSE [3] < CLOSE [4] AND VOLUMEAVG(LENGTH = 20) > VOLUMEAVG(LENGTH = 20)[1] AND VOLUMEAVG(LENGTH = 20)[1] > VOLUMEAVG(LENGTH = 20)[2] AND VOLUMEAVG(LENGTH = 20)[2] > VOLUMEAVG(LENGTH = 20)[3] and VOLUMEAVG(LENGTH = 20)[3] > VOLUMEAVG(LENGTH = 20)[4]);
plot bull4 = bullish5;
bull4.AssignValueColor(Color.CYAN);
bull4.SetPaintingStrategy(PaintingStrategy.BOOLEAN_ARROW_UP);

# Alerts
Alert(bull3, " ", Alert.Bar, Sound.Chimes);
Alert(bear3, " ", Alert.Bar, Sound.Chimes);
Alert(bull4, " ", Alert.Bar, Sound.Bell);
Alert(bear4, " ", Alert.Bar, Sound.Bell);
Shareable Link
https://tos.mx/uP5aTzAttachments
Last edited:


