Repaints MTF Price Trend Indicator for ThinkorSwim

Repaints

BenTen

Administrative
Staff member
Staff
VIP
Lifetime
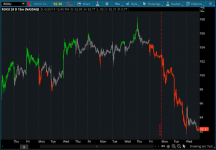
This is a fairly simple indicator for ThinkorSwim that shows the price trend in the candles.

Created by Drew Griffith.

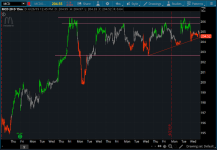
Color candlesticks based on price movement. New highs are green; New lows are red; Sideways trading are grey.

6VDal4h.png


thinkScript Code

Rich (BB code):
declare upper;

input trail = 1;
input displace = 1;
input aggregationperiod = aggregationperiod.day;

def new_high = close > highest(high(period = aggregationperiod), trail)[displace];
def new_low = close < lowest(low(period = aggregationperiod), trail)[displace];

def greenprice = if new_high then yes else if new_low then no else new_high[1];
def redprice = if new_low then yes else if new_high then no else new_low[1];

plot bullish = greenprice;
plot neutral = !greenprice and !redprice;
plot bearish = redprice;

plot rating =
if greenprice then 1
else if redprice then .5
else 0;

def paintbars = yes;

bullish.setdefaultcolor(color.uptick);
bullish.setpaintingstrategy(paintingstrategy.boolean_points);
bullish.setlineweight(3);
bullish.hide();
neutral.setdefaultcolor(color.gray);
neutral.setpaintingstrategy(paintingstrategy.boolean_points);
neutral.setlineweight(3);
neutral.hide();
bearish.setdefaultcolor(color.downtick);
bearish.setpaintingstrategy(paintingstrategy.boolean_points);
bearish.setlineweight(3);
bearish.hide();
rating.hide();
rating.hidebubble();

defineglobalcolor("bullish", color.uptick);
defineglobalcolor("neutral", color.gray);
defineglobalcolor("bearish", color.downtick);
assignpricecolor(if !paintbars then color.current else if greenprice then globalcolor("bullish") else if redprice then globalcolor("bearish") else globalcolor("neutral"));

Shareable Link

https://tos.mx/gxwvi5
 
Last edited:

Join useThinkScript to post your question to a community of 21,000+ developers and traders.

Another trend following indicator for ThinkorSwim. Similar to the one here, it will plot bearish, bullish, and neutral trend signals in the form of candles color. When adding the indicator, your candles will be assigned to either red, green, or grey.

Notes:
  • Red candles = bearish trend
  • Green candles = bullish trend
  • Gray = Neutral or Sideways trend
NsvIvn0.png

bFaiRbw.png


thinkScript Code

Code:
# PRICETREND
# DREWGRIFFITH15 (C) 2014
# Posted at https://github.com/hwrdprkns/ThinkOrSwim/blob/master/PriceTrendSTUDY.ts

DECLARE UPPER;

INPUT TRAIL = 1;
INPUT DISPLACE = 1;
INPUT AGGREGATIONPERIOD = AGGREGATIONPERIOD.DAY;

DEF NEW_HIGH = CLOSE > HIGHEST(HIGH(PERIOD = AGGREGATIONPERIOD), TRAIL)[DISPLACE];
DEF NEW_LOW = CLOSE < LOWEST(LOW(PERIOD = AGGREGATIONPERIOD), TRAIL)[DISPLACE];

DEF GREENPRICE = IF NEW_HIGH THEN YES ELSE IF NEW_LOW THEN NO ELSE NEW_HIGH[1];
DEF REDPRICE = IF NEW_LOW THEN YES ELSE IF NEW_HIGH THEN NO ELSE NEW_LOW[1];

PLOT BULLISH = GREENPRICE;
PLOT NEUTRAL = !GREENPRICE AND !REDPRICE;
PLOT BEARISH = REDPRICE;

PLOT RATING =
IF GREENPRICE THEN 1
ELSE IF REDPRICE THEN .5
ELSE 0;

DEF PAINTBARS = YES;

BULLISH.SETDEFAULTCOLOR(COLOR.UPTICK);
BULLISH.SETPAINTINGSTRATEGY(PAINTINGSTRATEGY.BOOLEAN_POINTS);
BULLISH.SETLINEWEIGHT(3);
BULLISH.HIDE();
NEUTRAL.SETDEFAULTCOLOR(COLOR.GRAY);
NEUTRAL.SETPAINTINGSTRATEGY(PAINTINGSTRATEGY.BOOLEAN_POINTS);
NEUTRAL.SETLINEWEIGHT(3);
NEUTRAL.HIDE();
BEARISH.SETDEFAULTCOLOR(COLOR.DOWNTICK);
BEARISH.SETPAINTINGSTRATEGY(PAINTINGSTRATEGY.BOOLEAN_POINTS);
BEARISH.SETLINEWEIGHT(3);
BEARISH.HIDE();
RATING.Hide();
RATING.HideBubble();

DEFINEGLOBALCOLOR("BULLISH", COLOR.UPTICK);
DEFINEGLOBALCOLOR("NEUTRAL", COLOR.GRAY);
DEFINEGLOBALCOLOR("BEARISH", COLOR.DOWNTICK);
ASSIGNPRICECOLOR(IF !PAINTBARS THEN COLOR.CURRENT ELSE IF GREENPRICE THEN GLOBALCOLOR("BULLISH") ELSE IF REDPRICE THEN GLOBALCOLOR("BEARISH") ELSE GLOBALCOLOR("NEUTRAL"));

Shareable Link

https://tos.mx/FCNKHF
 

Attachments

  • NsvIvn0.png
    NsvIvn0.png
    213.5 KB · Views: 233
  • bFaiRbw.png
    bFaiRbw.png
    256.9 KB · Views: 238
@BenTen hmm...very curious to see to see how this particular trend stacks up against Mobius SuperTrend...SuperTrend with Laguerre RSI and a Mobius version of a SuperTrend that I found somewhere down the grapevine...I don't think that version of the Mobius SuperTrend is on this site...I will share the code once I do the test to make sure how it compares and perhaps a NEW SuperTrend can be enhanced.

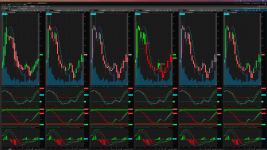
OK...So incase any one is interested how this PriceTrend compares to the rest of the trend indicators here are the results on a 15 min chart...Everything you see is in default settings.

From left to right:

Heikin Ashi
Standard Candlesticks
Blast Off SuperTrend with Laguerre RSI by @netarchitech
SuperTrend by Mobius found on this site
CandleTrend by Mobius from my archives
PriceTrend

JVfKlma.png


As you can see the PriceTrend indicator stacks up quite nicely and makes the entries precise with the specific candle color...What is really surprising to me is the CandleTrend by Mobius that I found in my archives...it has an option for higher aggregation period which will display the color of candles based on the aggregation period selected. For example...If you select a 15 min time aggregation but you're trading on a 5 min chart...the color trend will paint the candles based on the 15 min time frame on the 5 min chart...hence, the multi time frame as with everything else that we have seen. Very cool feature.

On both the PriceTrend and the Mobius CandleTrend the painting of the candles is somewhat sensitive and does change midway through the candles sometimes. This could be because its more sensitive or because of the higher timeframe my test was done at. Looking at both the CandleTrend and the PriceTrend simultaneously netted the best results from what I found in this test. I never really had all of them up and running at the same time until I stumbled upon this PriceTrend indicator post.

This leaves me to questions...is it possible to somehow merge the the Mobius CandleTrend and the PriceTrend together and form one Super Candle Price Trend Indicator?

The least accurate from my test was actually the original and most popular SuperTrend by Mobius...on a higher timeframe such as 15 min it just hit way to late although the candles did not change as much during the same time frame as on the Price Trend and Candle Trend...Same could be said about the Super Trend with Laguerre RSI...

Since @netarchitech helped with the Blast Off SuperTrend and did exactly what I wanted perhaps I can get an opinion on this new idea of enhancing the existing SuperTrends?
 

Attachments

  • JVfKlma.png
    JVfKlma.png
    544.4 KB · Views: 266

Similar threads

Not the exact question you're looking for?

Start a new thread and receive assistance from our community.

87k+ Posts
390 Online
Create Post

Similar threads

Similar threads

The Market Trading Game Changer

Join 2,500+ subscribers inside the useThinkScript VIP Membership Club
  • Exclusive indicators
  • Proven strategies & setups
  • Private Discord community
  • ‘Buy The Dip’ signal alerts
  • Exclusive members-only content
  • Add-ons and resources
  • 1 full year of unlimited support

Frequently Asked Questions

What is useThinkScript?

useThinkScript is the #1 community of stock market investors using indicators and other tools to power their trading strategies. Traders of all skill levels use our forums to learn about scripting and indicators, help each other, and discover new ways to gain an edge in the markets.

How do I get started?

We get it. Our forum can be intimidating, if not overwhelming. With thousands of topics, tens of thousands of posts, our community has created an incredibly deep knowledge base for stock traders. No one can ever exhaust every resource provided on our site.

If you are new, or just looking for guidance, here are some helpful links to get you started.

What are the benefits of VIP Membership?
VIP members get exclusive access to these proven and tested premium indicators: Buy the Dip, Advanced Market Moves 2.0, Take Profit, and Volatility Trading Range. In addition, VIP members get access to over 50 VIP-only custom indicators, add-ons, and strategies, private VIP-only forums, private Discord channel to discuss trades and strategies in real-time, customer support, trade alerts, and much more. Learn all about VIP membership here.
How can I access the premium indicators?
To access the premium indicators, which are plug and play ready, sign up for VIP membership here.
Back
Top