price pulls back near the 1 ATR Swing Strategy

VKT

New member
VIP
I was tracking NOW for past couple of days and I missed the jumped.
Is it possible to have RSI-HA scanner please???
https://usethinkscript.com/threads/rsi-ha-trend.19862/

I am a swing trader utilizing a multi-timeframe approach that combines trend alignment, momentum squeezes, and structured price channels to identify high-probability setups.

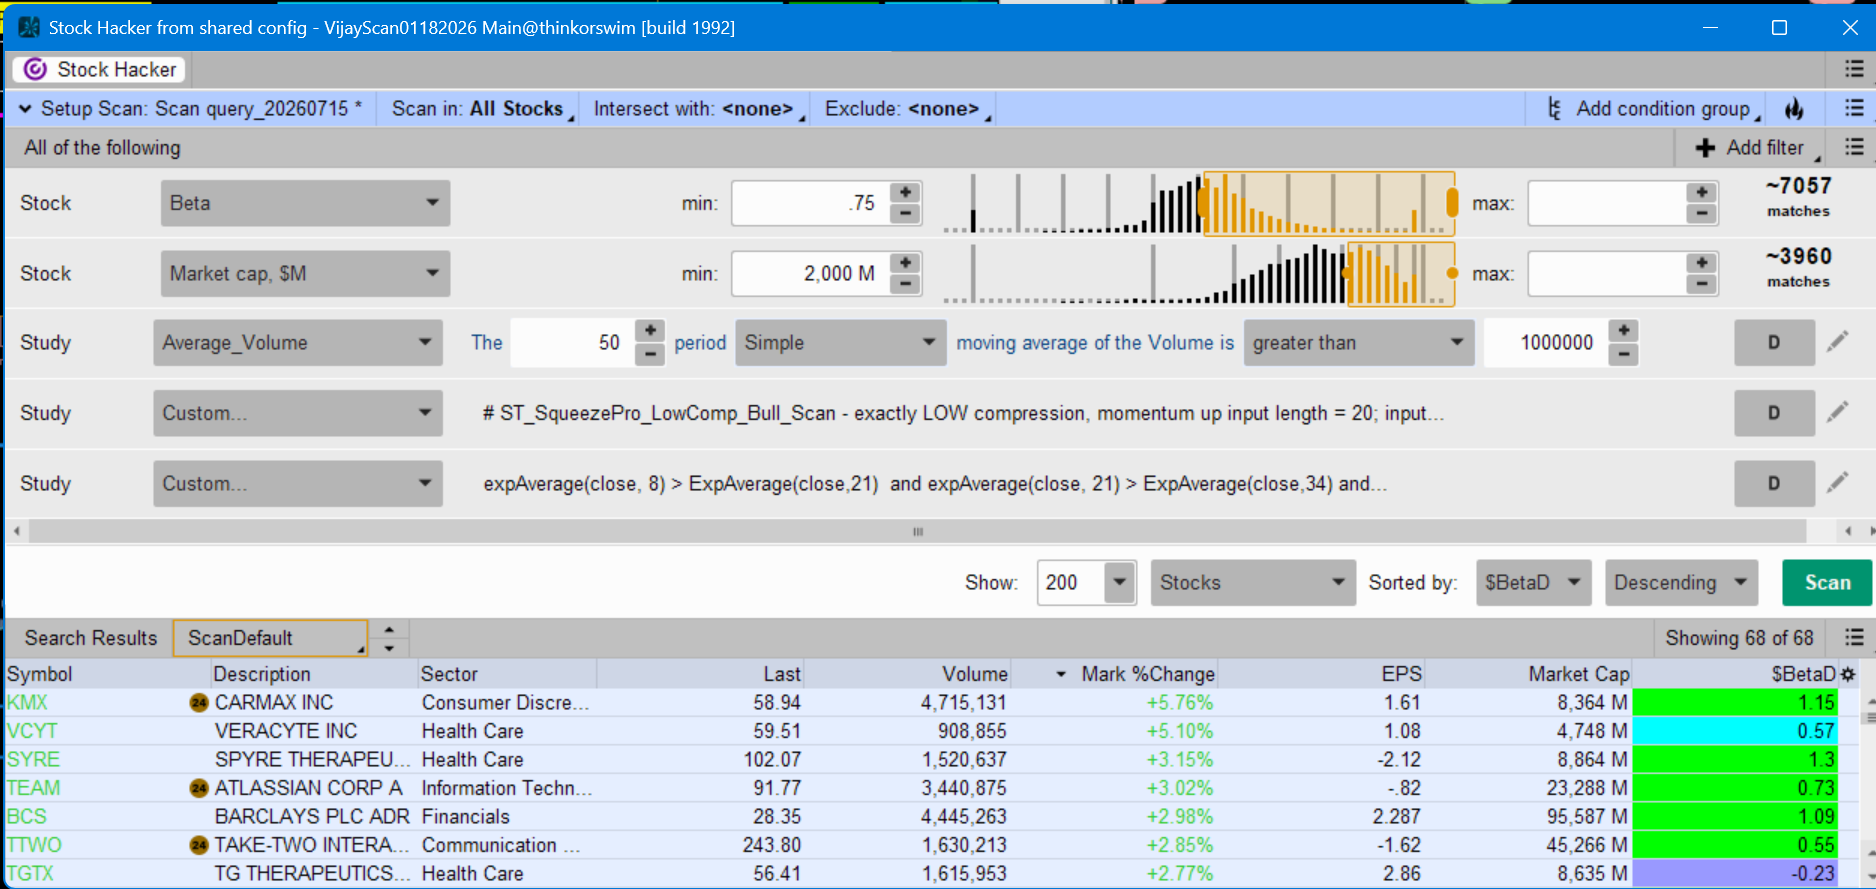
1. Trend Selection & Screening Moving Averages: I scan the daily timeframe for a stacked Exponential Moving Average (EMA) alignment (8 EMA > 21 EMA > 34 EMA > 55 EMA) to confirm a strong bullish trend.

Momentum Indicator: The TTM Squeeze must be active (on), and the momentum histogram must be positive (above the zero line).

Structural Filter: I use a Linear Regression Channel within my scanning parameters to define the overarching market structure and boundaries.

2. Trade Execution & Risk Management

Trade Entry (Buy): I enter long positions on the daily chart when the price pulls back near the 1 Average True Range (ATR) band.

Trade Exit (Sell): I take profits when the price expands to target zones between the 2 and 3 ATR bands on the daily chart.

Multi-Timeframe Refinement: While setup selection happens on the daily timeframe, I always analyze the 1-hour and 15-minute charts to refine my entries, exits, and execution decisions.

Scan - http://tos.mx/!FAsyQV6b
kPRLmEL.png


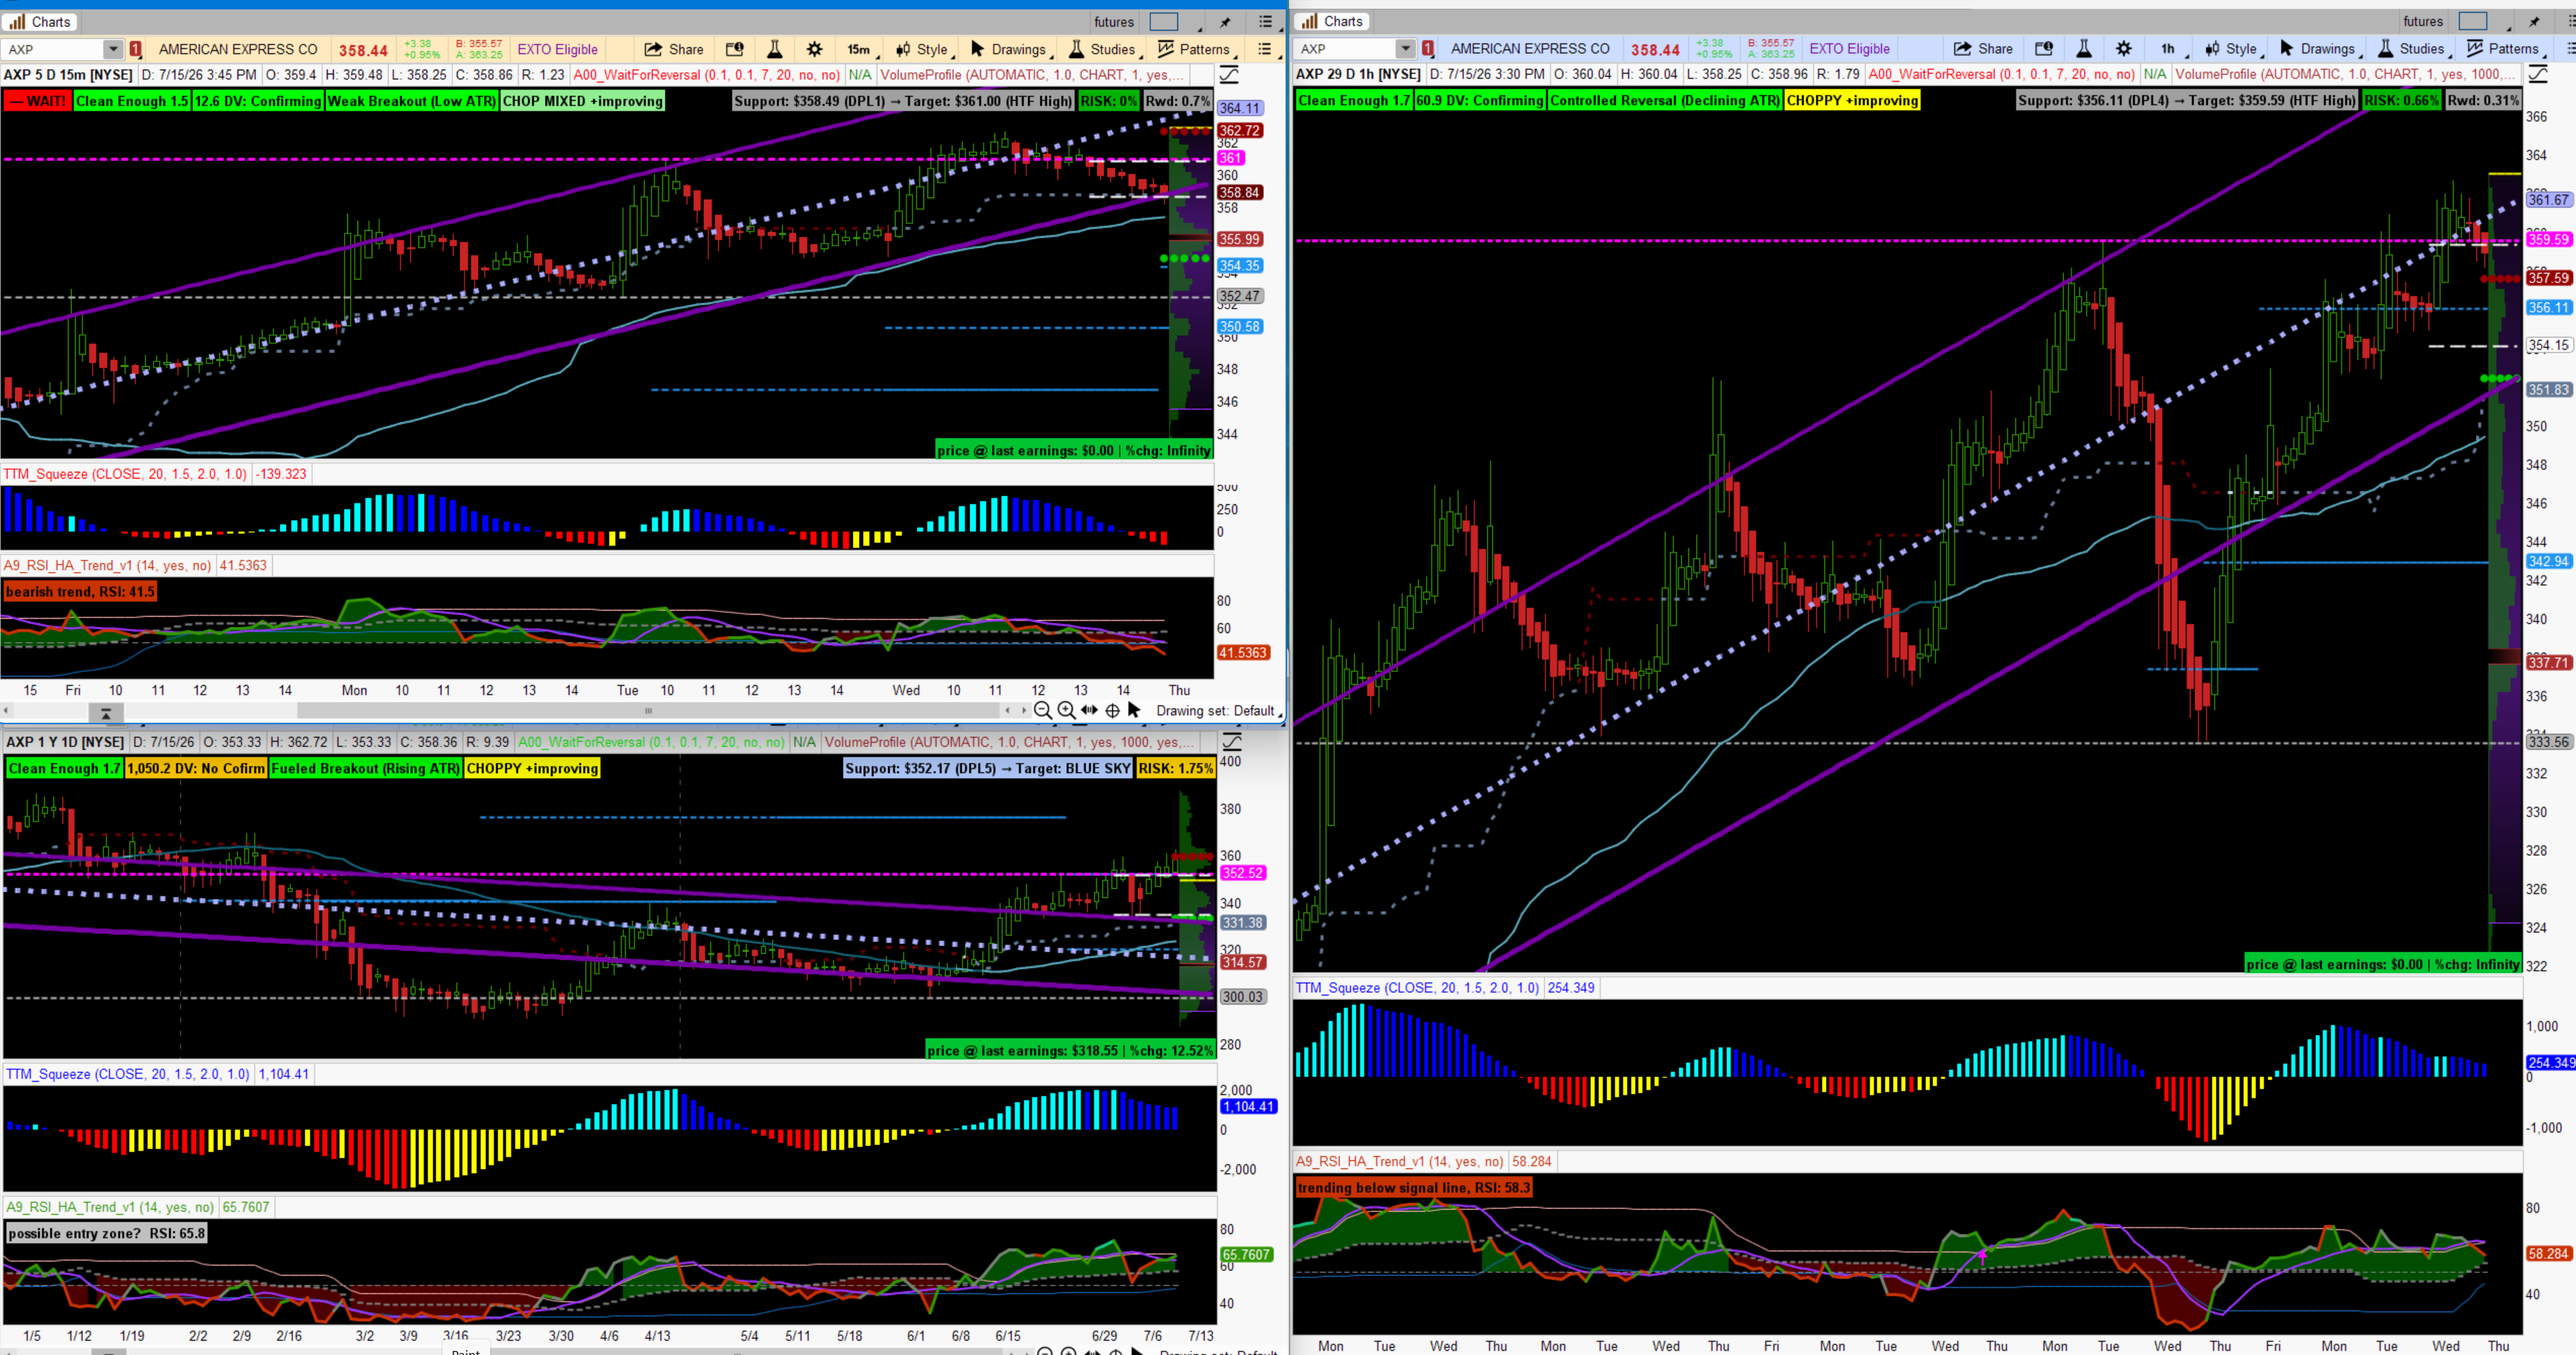
Scan result- AXP exhibits a highly favorable setup and meets all criteria for our trading strategy.

The RSI-HA (Heikin Ashi) indicator will integrate volume analysis and RSI momentum thresholds into the scanning criteria.
 

Attachments
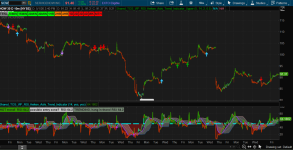
  • RSI-HA_Screenshot.png
    RSI-HA_Screenshot.png
    499.1 KB · Views: 47
Last edited by a moderator:
Trying to visualize your strategy.
Could you explain what you are seeing in AXP?
What do you see as setting up?
What are you seeing as your potential target?
What are you using to identify your support and resistance?

What is the average length of your trades?
r6uOcbG.png
 
Last edited by a moderator:
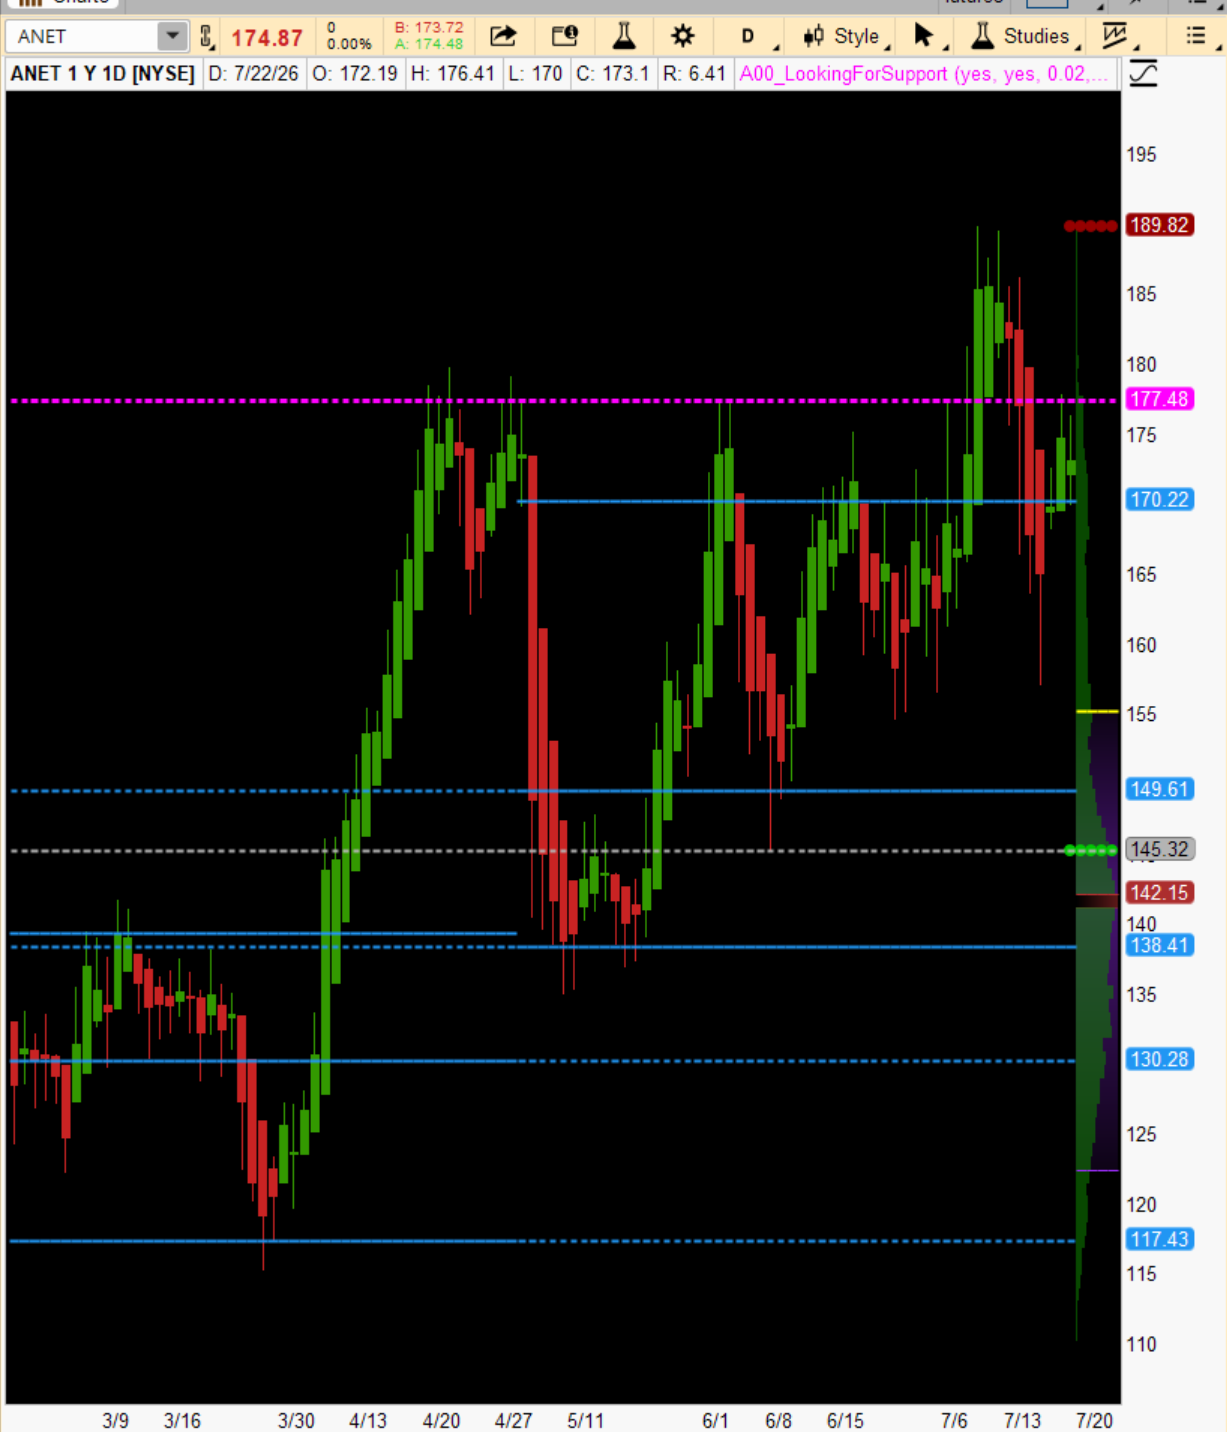
@merryDay - Thanks for starting a new thread! My setup is a bit different now compared to when I looked at $AXP, but I ran the same scan and caught $ANET.

1784780775424.png


Reasons to pick $ANET

Above 50 SMA on weekly chart.
Above 50 SMA on Daily Chart
Above 50 SMA on Hourly Chart
Stacked EMA (8 EMA > 21 EMA > 34 EMA > 55EMA)
RSI > 50
Daily and Weekly - Squeeze one with histograms are above zero.
Current price is at 20 SMA (below 1 ATR)
Support - 168.5 (34 EMA), Resistance - 192.27 (2 ATR)

Book Profit - As stock price moves above 1 ATR ( Between181.87 - 185.14)
Timeframe - 2 Weeks

1784782377271.png
 
TL;DR
KAs0DPE.png


What Makes A Successful Swing Trader?​

Successful swing trading is about reading the market environment. Before every trade, you should know what the overall market is doing, whether the stock's sector is leading or lagging, when earnings are scheduled, what major news could affect price, and where the important support and resistance levels are located.

1. Macro Backdrop: Geopolitical Risk & Sector Capital Rotation​

The Environment: Huge escalation in the Iran Conflict has money rotating out of tech and into defensive refuges—specifically Energy, Defense, Gold, and Cash.​
Sector Impact: Tech stocks like $ANET are suffering a liquidity drain.​
A swing trade during a tech sell-off would be facing a massive headwind.​

2. Binary Event Risk: Q2 Earnings​

The Date: Arista Networks reports Q2 earnings on Tuesday, August 4th.​
The Conflict: A 2-week swing runs straight through the earnings report.​
Yes, ANET routinely sees 10%–15% overnight gaps on earnings. But the current geopolitical friction is making that into a binary coin-flip gamble.​

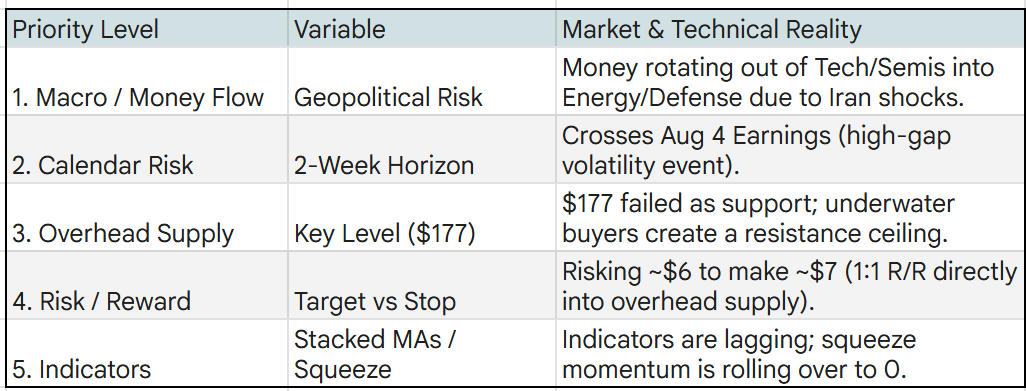
3. Immediate Technical Trap: Heavy Overhead Supply at $177​

Failed Support: $177 was former resistance from May that briefly acted as a breakout trigger up to $189.​
Current Breakdown: The recent sharp drop from $189 down to $174 slashed straight through $177 on heavy volume.​
The "Bagholder" Wall: $177 is no longer support—it is now a wall of trapped buyers (overhead supply). Anyone who bought above $177 is underwater. Any attempt to rally back toward $177 will face heavy selling from traders looking to get out at breakeven.​

Support & Resistance
https://usethinkscript.com/threads/the-vip-support-target-engine-with-risk-reward.22181/
tS7RLNX.png


4. Poor Risk-to-Reward Ratio​

The Numbers: Entry at ~$174.87, target at $181.87–$185.14 (+~$7.00 upside), support at $168.50 (-~$6.30 downside).​
The Math: Risking $6.30 to make $7.00 is nearly a 1:1 Risk/Reward ratio. Taking a 1:1 risk profile while trying to punch through a fresh resistance wall at $177 during a tech sector selloff is sub-optimal.​

5. Fading Momentum & Lagging Indicators​

Moving Averages: While the 8/21/34/55 EMAs appear stacked from the previous run up to $189, MAs are lagging indicators. Buying a stock mid-cliff-drop just because lagging lines haven't crossed yet is catching a falling knife.​
Rolling Squeeze: The TOS Squeeze histogram peaked in early July and has been steadily shrinking toward zero. The squeeze expansion already happened during the push to $189; entering now catches the tail-end of a fading cycle.​

Between the macro rotation out of tech into energy/defense, the binary threat of August 4th earnings, and a major wall of trapped sellers sitting right at $177, this chart offers virtually no margin of safety for a swing trade right now.

Your chart analysis was not wrong; if you are scalping or short daytrading.
However for swing trading; it lacks the required market environment analysis.
1. MARKET → Broad Index Trend & Risk Sentiment

2. SECTOR → Sector Relative Strength & Capital Flows

3. CORRELATION → Intermarket Drivers (Yields, Oil, VIX, Peers)

4. HTF CONTEXT → Weekly & Monthly Structural Trends

5. STRUCTURE → Daily Trend Character (HH/HL vs. Lower Highs)

6. ENVIRONMENT → Catalysts & Binary Event Risk (Earnings, CPI)

7. SUPPORT → True Supply & Demand Zones (Not Lagging MAs)

8. ENTRY → Trigger, Stop Loss, Target & R/R Ratio

Hope this helps?
@VKT
 
Last edited:
Last edited by a moderator:

Join useThinkScript to post your question to a community of 21,000+ developers and traders.

Not the exact question you're looking for?

Start a new thread and receive assistance from our community.

87k+ Posts
1939 Online
Create Post

The Market Trading Game Changer

Join 2,500+ subscribers inside the useThinkScript VIP Membership Club
  • Exclusive indicators
  • Proven strategies & setups
  • Private Discord community
  • ‘Buy The Dip’ signal alerts
  • Exclusive members-only content
  • Add-ons and resources
  • 1 full year of unlimited support

Frequently Asked Questions

What is useThinkScript?

useThinkScript is the #1 community of stock market investors using indicators and other tools to power their trading strategies. Traders of all skill levels use our forums to learn about scripting and indicators, help each other, and discover new ways to gain an edge in the markets.

How do I get started?

We get it. Our forum can be intimidating, if not overwhelming. With thousands of topics, tens of thousands of posts, our community has created an incredibly deep knowledge base for stock traders. No one can ever exhaust every resource provided on our site.

If you are new, or just looking for guidance, here are some helpful links to get you started.

What are the benefits of VIP Membership?
VIP members get exclusive access to these proven and tested premium indicators: Buy the Dip, Advanced Market Moves 2.0, Take Profit, and Volatility Trading Range. In addition, VIP members get access to over 50 VIP-only custom indicators, add-ons, and strategies, private VIP-only forums, private Discord channel to discuss trades and strategies in real-time, customer support, trade alerts, and much more. Learn all about VIP membership here.
How can I access the premium indicators?
To access the premium indicators, which are plug and play ready, sign up for VIP membership here.
Back
Top