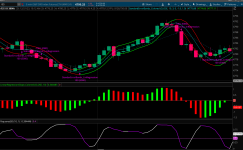
Screaming Price Moves For ThinkOrSwim

congamike

New member
Many years ago, when I screened fundamentals for a company, I discovered that "up for the week, month, and quarter", added value to my boss's list of parameters.
Now that I am applying STRAT principles to scalping, I am tied to Time Frame Continuity even more tightly.
So, what is "Bullish," what is "Bearish?" Red and green candles make that determination I am told. The only other condition is consolidation.
In my experience, there is a fourth: I refer to it as "Screaming". Screaming may be observed by viewing Bollinger Bands. Any activity outside of the bands is very interesting indeed. Trending and consolidating is also easily identifiable. John Bollinger even has a book that teaches the use of his bands. Good stuff and highly recommended. I ultimately went with Standard Error Bands because I see less overshoot.
So with these bands, with tight parameters, trading on the 2 minute chart with permission of the 15 minute chart, I began making a profit in my demo account. Feel free to adapt the time frames to your preference.
The Standard Error band study and the Bollinger band study is already provided for us.
In this script, I add color to Error bands so that only absolute consolidations are white. Bullish and bearish conditions are decorated with Christmas colors. Pretty simple stuff but it may help clear up some brain fog some fine day.

Further embellishments to follow..
Here is the code (and my first script offering here).

</>
# 9-27-23 congamike
input price = close;
input linRegLength = 10;
input smLength = 3;
input displace = 0;
input Num_Dev_Dn = -1.0;
input Num_Dev_Up = 1.0;

def value = Average(Inertia(price[-displace], linRegLength), smLength);
def error = Average(sterr(price[-displace], linRegLength), smLength);

#plot MidLine = value;
plot LowerBand = value + Num_Dev_Dn * error;
plot UpperBand = value + Num_Dev_Up * error;

#MidLine.SetDefaultColor(GetColor(5));
UpperBand.SetDefaultColor(GetColor(8));
LowerBand.SetDefaultColor(GetColor(8));

def UDiff = UpperBand - UpperBand[1];
def DDiff = LowerBand - LowerBand[1];

UpperBand.AssignValueColor(if UDiff > .1 then Color.UPTICK else if UDiff < -.1 then Color.DOWNTICK else Color.WHITE);
LowerBand.AssignValueColor(if DDiff > .1 then Color.UPTICK else if UDiff < -.1 then Color.DOWNTICK else Color.WHITE);
 
Last edited:

Join useThinkScript to post your question to a community of 21,000+ developers and traders.

SO, what can be done with this to make it more useful?
If I had a grid of 6 or 9 different time frame charts of the same instrument, which of these are screaming? Are a bunch of them, or just one?
Let's make that easy... Here I turn the background colors Christmas'ey.


#MyBackgroundColor
# 9-24-23 congamike
input price = close;
input linRegLength = 10;
input smLength = 3;
input displace = 0;
input Num_Dev_Dn = -1.0;
input Num_Dev_Up = 1.0;

def value = Average(Inertia(price[-displace], linRegLength), smLength);
def error = Average(sterr(price[-displace], linRegLength), smLength);

#plot MidLine = value;
def LowerBand = value + Num_Dev_Dn * error;
def UpperBand = value + Num_Dev_Up * error;

AssignBackgroundColor(if close > UpperBand then Color.DARK_GREEN else if close < LowerBand then Color.dark_red else color.black);
 
Here is a toy that might be fun to play with:
I created a "strategy".
The entry and exit is not where I would define them manually, but I lack the programming skill to fix that up. Further, not all defined entries would be taken at all.
That said, It seems to work well with the /ES on the 15 minute chart, which is encouraging.

</>

# 9-24-23 congamike
input price = close;
input linRegLength = 10;
input smLength = 3;
input displace = 0;
input Num_Dev_Dn = -1.0;
input Num_Dev_Up = 1.0;

def value = Average(Inertia(price[-displace], linRegLength), smLength);
def error = Average(sterr(price[-displace], linRegLength), smLength);

#plot MidLine = value;
def LowerBand = value + Num_Dev_Dn * error;
def UpperBand = value + Num_Dev_Up * error;

AddOrder(OrderType.BUY_AUTO, price crosses above UpperBand);
AddOrder(OrderType.SELL_AUTO, price crosses below LowerBand);
Pretty wild. I took the add order conditions and changed them slightly(see below) just to see what kind of results it would get if it was long only instead of alternation continuously between the 2 and the P/L was interesting to say the least.

Code:
AddOrder(OrderType.BUY_AUTO, price crosses above UpperBand and ,open[-1] , 4, tickcolor = Color.GREEN, arrowcolor = Color.GREEN);

AddOrder(OrderType.SELL_TO_CLOSE, price crosses below LowerBand, open[-1] , 4, tickcolor = Color.RED, arrowcolor = Color.RED);


Have you done anything else with this strategy?
 
Try this....

#---
input MAlength = 9;
def AvgExp = ExpAverage(price[-displace], MAlength);
#---

AddOrder(OrderType.BUY_TO_OPEN, price > UpperBand and price > AvgExp);
AddOrder(OrderType.SELL_To_Close, price crosses below UpperBand);
 
Not sure if it means much to you, but the long entries are most accurate at a certain time:

Code:
and SecondsFromTime(0945) >= 0 and SecondsTillTime(1015) >= 0
 
Another way to make these bands useful is for the watchlist to have them too! I watch the 5', the 15', and the 60' but your preferences will likely vary.
Huge thanks to Pelonsax. I used his excellent watchlist code as the basis for my script. Oh! He has a youtube video teaching how this can be installed in your platform

SO, that is all I have. The color bands, the background colors, the watchlist colors, and the strategy code. None can be considered skilled coding, but they help me trade. Further, this may be used as a wrapper around MA's, BBands, or whatever you like.

I just pulled 10 handles out of /YM in 3 seconds! - I told you it finds screamers!

I can't wait for a good programmer to pick this concept up and run with it. Let me know.

Oh. I also find it helpful to add things like UVXY and $DXY to the watchlist just to keep me appraised of market conditions at a glance.
#------------------------------------
# SCENARIOS
#------------------------------------
def H = high;
def L = low;
def C = close;
def O = open;
#----------------
input linRegLength = 10;
input smLength = 3;
input displace = 0;
input Num_Dev_Dn = -1.0;
input Num_Dev_Up = 1.0;

def value = Average(Inertia(C[-displace], linRegLength), smLength);
def error = Average(sterr(C[-displace], linRegLength), smLength);
#plot MidLine = value;
def LowerBand = value + Num_Dev_Dn * error;
def UpperBand = value + Num_Dev_Up * error;
#__________________

def bull = (C > UpperBand);
def bear = (C < LowerBand);
# -------------------------
# Labels
# -------------------------
AddLabel(yes, if
bull then "Bull" else if
bear then "Bear" else "-", Color.BLACK);
# -------------------------
# Colors
# -------------------------

AssignBackgroundColor(if
bull then Color.GREEN else if
bear then Color.RED else Color.BLACK);
 
Last edited:
Code:
AddOrder(OrderType.BUY_AUTO, price crosses above UpperBand and ,open[-1] , 4, tickcolor = Color.GREEN, arrowcolor = Color.GREEN);

AddOrder(OrderType.SELL_TO_CLOSE, price crosses below LowerBand, open[-1] , 4, tickcolor = Color.RED, arrowcolor = Color.RED);


Have you done anything else with this strategy?


Thanks for this. I will use this code as a sample if I need to make edits.
I did install it. TOS doesn't seem to like it.
--
On monitor 2, I use a matrix of charts: W, D, 4h, 1h, 15'er, and 1'er.

One day was interesting. At about 9:15 I saw that the hour, 15'er, and 1 were red, so I shorted.
I covered when the 1'er went green.
Easy Peasy 10 handles in about 1/2 hour!
 
Last edited by a moderator:
Pretty wild. I took the add order conditions and changed them slightly(see below) just to see what kind of results it would get if it was long only instead of alternation continuously between the 2 and the P/L was interesting to say the least.

Code:
AddOrder(OrderType.BUY_AUTO, price crosses above UpperBand and ,open[-1] , 4, tickcolor = Color.GREEN, arrowcolor = Color.GREEN);

AddOrder(OrderType.SELL_TO_CLOSE, price crosses below LowerBand, open[-1] , 4, tickcolor = Color.RED, arrowcolor = Color.RED);

Have you done anything else with this strategy?
 
Last edited by a moderator:
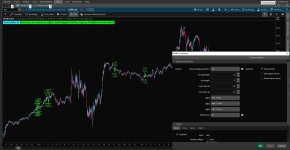
Okay, I liked the simplicity of this idea so I messed around with it a bit and added MTF support. Would possibly be easier than creating a grid with multiple timeframes but YMMV. What I've tried to capture here is when the lower timeframe chart falls 'out of alignment' with the larger timeframe, that should be viewed as a pullback. When it flips back 'into alignment' with the larger timeframe, a buy or sell signal is created. I've added two secondary periods with the option of displaying the bands from the first one.

As this is a multi-timeframe setup, the bands repaint until the candle closes. This can lead to some disappearing signals. I have tried to accomodate for that by ensuring the signal happens above or below the current bands (ie. We want to buy when price is above the HTF band and sell when price is below it). This should not be used in a strategy as MTF inside of strategies cause misleading results (I did not know this :oops:)

At any rate, I had fun messing around with it. If anyone has ideas, let me know.

Ruby:
# 9-24-23 congamike
input htf = AggregationPeriod.HOUR;
def price_htf = close(period = htf);
input linRegLength = 10;
input smLength = 3;
input displace = 0;
input Num_Dev_Dn = -1.0;
input Num_Dev_Up = 1.0;

def value_htf = Average(Inertia(price_htf[-displace], linRegLength), smLength);
def error_htf = Average(sterr(price_htf[-displace], linRegLength), smLength);

#plot MidLine = value;
def LowerBand_htf = value_htf + Num_Dev_Dn * error_htf;
def UpperBand_htf = value_htf + Num_Dev_Up * error_htf;

def UDiff = UpperBand_htf - UpperBand_htf[1];
def DDiff = LowerBand_htf - LowerBand_htf[1];

def htfGreen = price_htf > UpperBand_htf and UDiff > 0.1;
def htfRed = price_htf < LowerBand_htf and UDiff < -0.1;

input htf2 = AggregationPeriod.THIRTY_MIN;
def price_htf2 = close(period = htf2);

def value_htf2 = Average(Inertia(price_htf2[-displace], linRegLength), smLength);
def error_htf2 = Average(sterr(price_htf2[-displace], linRegLength), smLength);

#plot MidLine = value;
def LowerBand_htf2 = value_htf2 + Num_Dev_Dn * error_htf2;
def UpperBand_htf2 = value_htf2 + Num_Dev_Up * error_htf2;

def UDiff2 = UpperBand_htf2 - UpperBand_htf2[1];
def DDiff2 = LowerBand_htf2 - LowerBand_htf2[1];

def htfGreen2 = price_htf2 > UpperBand_htf2 and UDiff2 > 0.1;
def htfRed2 = price_htf2 < LowerBand_htf2 and UDiff2 < -0.1;

#---
input MAlength = 9;
def AvgExp = ExpAverage(price_htf[-displace], MAlength);
#---


def price = close;

def value = Average(Inertia(price[-displace], linRegLength), smLength);
def error = Average(sterr(price[-displace], linRegLength), smLength);

#plot MidLine = value;
def LowerBand = value + Num_Dev_Dn * error;
def UpperBand = value + Num_Dev_Up * error;

def Udiff3 = UpperBand - UpperBand[1];
def DDiff3 = LowerBand - LowerBand[1];

def bearish = UDiff3 < -0.1 and DDiff3 < -0.1;
def bullish = UDiff3 > 0.1 and DDiff3 > 0.1;
def bullSignal = price crosses above UpperBand and price[1] > LowerBand_htf[1] and (bearish within 5 bars);
def bearSignal = price crosses below LowerBand and price[1] < UpperBand_htf[1] and (bullish within 5 bars);
plot buyArrow = if htfGreen and htfGreen2 and bullSignal then low else Double.NaN;
buyArrow.setPaintingStrategy(PaintingStrategy.ARROW_UP);
buyArrow.setDefaultColor(Color.WHITE);
plot sellArrow = if htfRed and htfRed2 and bearSignal then high else Double.NaN;
sellArrow.setPaintingStrategy(PaintingStrategy.ARROW_DOWN);
sellArrow.setDefaultColor(Color.WHITE);

input showHTFBands = no;
plot UBHTF = if showHTFBands then UpperBand_htf else Double.NaN;
UBHTF.setDefaultColor(Color.GRAY);
plot LBHTF = if showHTFBands then LowerBand_htf else Double.NaN;
LBHTF.setDefaultColor(Color.GRAY);


UBHTF.AssignValueColor(if UDiff > .1 then Color.UPTICK else if UDiff < -.1 then Color.DOWNTICK else Color.WHITE);
LBHTF.AssignValueColor(if DDiff > .1 then Color.UPTICK else if UDiff < -.1 then Color.DOWNTICK else Color.WHITE);
 
Last edited:
Try this....

#---
input MAlength = 9;
def AvgExp = ExpAverage(price[-displace], MAlength);
#---

AddOrder(OrderType.BUY_TO_OPEN, price > UpperBand and price > AvgExp);
AddOrder(OrderType.SELL_To_Close, price crosses below UpperBand);
Okay, I'll give it a try and I'll see what it looks like. I've tried a few ideas and they just lower the P/L with slightly more accurate trades. I'm trying to find a way to preserve the P/L more while increasing the win rate. If I find a way I'll share it with you.
 
Okay, I'll give it a try and I'll see what it looks like. I've tried a few ideas and they just lower the P/L with slightly more accurate trades. I'm trying to find a way to preserve the P/L more while increasing the win rate. If I find a way I'll share it with you.
Really like trading with Standard Error Bands in combination with R-squared and Linear regression Slope. Is it possible to build a Standard Error Bands Histogram? My idea is to see when the bands start to widen/narrow. Thank you.

Here is a toy that might be fun to play with:
I created a "strategy".
The entry and exit is not where I would define them manually, but I lack the programming skill to fix that up. Further, not all defined entries would be taken at all.
That said, It seems to work well with the /ES on the 15 minute chart, which is encouraging.

</>

# 9-24-23 congamike
input price = close;
input linRegLength = 10;
input smLength = 3;
input displace = 0;
input Num_Dev_Dn = -1.0;
input Num_Dev_Up = 1.0;

def value = Average(Inertia(price[-displace], linRegLength), smLength);
def error = Average(sterr(price[-displace], linRegLength), smLength);

#plot MidLine = value;
def LowerBand = value + Num_Dev_Dn * error;
def UpperBand = value + Num_Dev_Up * error;

AddOrder(OrderType.BUY_AUTO, price crosses above UpperBand);
AddOrder(OrderType.SELL_AUTO, price crosses below LowerBand);
I really like your Standard Error Bands set up. I have been using them (standard 2 dev set up) in my trading strategy along with Linear Reg. Slope (set as histogram) and R-squared (should include it's critical value). Both are 20 periods. I was wondering if it possible to build the Error bands histogram? Sounds crazy, but my thought was to see when precisely they begin to narrow/widen. And overall, see the correlation with some indicators. Thank you.
 
Pretty wild. I took the add order conditions and changed them slightly(see below) just to see what kind of results it would get if it was long only instead of alternation continuously between the 2 and the P/L was interesting to say the least.

Code:
AddOrder(OrderType.BUY_AUTO, price crosses above UpperBand and ,open[-1] , 4, tickcolor = Color.GREEN, arrowcolor = Color.GREEN);

AddOrder(OrderType.SELL_TO_CLOSE, price crosses below LowerBand, open[-1] , 4, tickcolor = Color.RED, arrowcolor = Color.RED);


Have you done anything else with this strategy?


You have an extra "and" in the BUY_AUTO. Corrected below:
Code:
AddOrder(OrderType.BUY_AUTO, price crosses above UpperBand, open[-1] , 4, tickcolor = Color.GREEN, arrowcolor = Color.GREEN);

AddOrder(OrderType.SELL_TO_CLOSE, price crosses below LowerBand, open[-1] , 4, tickcolor = Color.RED, arrowcolor = Color.RED);
 

I can't wait for a good programmer to pick this concept up and run with it. Let me know.


Can't say I'm a good programmer .. but I try .. Merry Christmas!!!

(This should not repaint, but it does lag one candle on the higher timeframes.)


Ruby:
# 9-24-23 congamike
# 12-25-23 dap711 modifications
#Floating PL by MerryDay

input ShowStategyPositions = yes;
#Hint ShowStategyPositions: Plot the historical trades on the chart. Needed to calculate the floating P/L.
input linRegLength = 10;
input smLength = 3;
input Num_Dev_Dn = -1.0;
input Num_Dev_Up = 1.0;
input agg2 = AggregationPeriod.FIVE_MIN;
input agg3 = AggregationPeriod.FIFTEEN_MIN;
input agg4 = AggregationPeriod.HOUR;

def value = Average(Inertia(close, linRegLength), smLength);
def error = Average(sterr(close, linRegLength), smLength);

def value2 = Average(Inertia(close(period = agg2)[agg2/60000], linRegLength), smLength);
def error2 = Average(sterr(close(period = agg2)[agg2/60000], linRegLength), smLength);

def value3 = Average(Inertia(close(period = agg3)[agg3/60000], linRegLength), smLength);
def error3 = Average(sterr(close(period = agg3)[agg3/60000], linRegLength), smLength);

def value4 = Average(Inertia(close(period = agg4)[agg4/60000], linRegLength), smLength);
def error4 = Average(sterr(close(period = agg4)[agg4/60000], linRegLength), smLength);

#plot MidLine = value;
def LowerBand = value + Num_Dev_Dn * error;
def UpperBand = value + Num_Dev_Up * error;

def LowerBand2 = value2 + Num_Dev_Dn * error2;
def UpperBand2 = value2 + Num_Dev_Up * error2;

def LowerBand3 = value3 + Num_Dev_Dn * error3;
def UpperBand3 = value3 + Num_Dev_Up * error3;

def LowerBand4 = value4 + Num_Dev_Dn * error4;
def UpperBand4 = value4 + Num_Dev_Up * error4;

def BuyOpen =   close crosses above UpperBand and
                close(period = agg2)[agg2/60000] > UpperBand2 and
                close(period = agg3)[agg3/60000] > UpperBand3 and
                close(period = agg4)[agg4/60000] > UpperBand4;

#def BuyClose = close(period = agg4)[agg4/60000] < UpperBand4;
#You can try the above instead to hold the trade longer. Just comment out the below and uncomment the above.
def BuyClose = close < UpperBand;

AddOrder(OrderType.BUY_TO_OPEN, BuyOpen and ShowStategyPositions, open[-1] , 1, tickcolor = Color.GREEN, arrowcolor = Color.GREEN, name="Open");

AddOrder(OrderType.SELL_TO_CLOSE, BuyClose and ShowStategyPositions, open[-1] , 1, tickcolor = Color.GREEN, arrowcolor = Color.GREEN, name="Close");


def SellOpen =   close crosses below LowerBand and
                close(period = agg2)[agg2/60000] < LowerBand2 and
                close(period = agg3)[agg3/60000] < LowerBand3 and
                close(period = agg4)[agg4/60000] < LowerBand4;

#def SellClose =  close(period = agg4)[agg4/60000] crosses above LowerBand4;
#You can try the above instead to hold the trade longer. Just comment out the below and uncomment the above.
def SellClose =  close crosses above LowerBand;

AddOrder(OrderType.SELL_TO_OPEN, SellOpen and ShowStategyPositions, open[-1] , 1, tickcolor = Color.RED, arrowcolor = Color.RED, name="Open");

AddOrder(OrderType.BUY_TO_CLOSE, SellClose and ShowStategyPositions, open[-1] , 1, tickcolor = Color.RED, arrowcolor = Color.RED, name="Open");


#//FloatingProfitLoss Labels
#####################################################################################################
script incrementValue {
    input condition = yes;
    input increment =  1;
    input startingValue = 0;
    def _value = CompoundValue(1,if condition then _value[1] + increment else _value[1], startingValue);
    plot incrementValue = _value;
}
def fplTargetWinLoss = .50;
def fplTargetWinRate = 1;
input HidePrices = no;
#Hint HidePrices: Useful to see posistions without the candles on the chart. Must have "show strategy positions" set to yes.
def fplHideFPL = yes;
def targetWinLoss = fplTargetWinLoss;
def targetWinRate = fplTargetWinRate;
def nan = Double.NaN;
def bn = if !IsNaN(close) and !IsNaN(close[1]) and !IsNaN(close[-1]) then BarNumber() else bn[1];
HidePricePlot(hidePrices);
def FPL = FPL();

# Entry Calculations.  Note: Only parses on a Strategy Chart
def entry = EntryPrice();
def entryPrice = if !IsNaN(entry) then entry else entryPrice[1];
def hasEntry = !IsNaN(entry);
def isNewEntry = entryPrice != entryPrice[1];

#is active trade
def highFPL = HighestAll(FPL);
def lowFPL = LowestAll(FPL);
def fplreturn = (FPL - FPL[1]) / FPL[1];
def cumsum = Sum(fplreturn);
def highBarNumber = CompoundValue(1, if FPL == highFPL then bn else highBarNumber[1], 0);
def lowBarNumber = CompoundValue(1, if FPL == lowFPL then bn else lowBarNumber[1], 0);

#Win/Loss ratios
def entryBarsTemp = if hasEntry then bn else nan;
def entryBarNum = if hasEntry and isNewEntry then bn else entryBarNum[1];
def isEntryBar = entryBarNum != entryBarNum[1];
def entryBarPL = if isEntryBar then FPL else entryBarPL[1];
def exitBarsTemp = if !hasEntry and bn > entryBarsTemp[1] then bn else nan;
def exitBarNum = if !hasEntry and !IsNaN(exitBarsTemp[1]) then bn else exitBarNum[1];
def isExitBar = exitBarNum != exitBarNum[1];
def exitBarPL = if isExitBar then FPL else exitBarPL[1];
def entryReturn = if isExitBar then exitBarPL - exitBarPL[1] else entryReturn[1];
def isWin = if isExitBar and entryReturn >= 0 then 1 else 0;
def isLoss = if isExitBar and entryReturn < 0 then 1 else 0;
def entryReturnWin = if isWin then entryReturn else entryReturnWin[1];
def entryReturnLoss = if isLoss then entryReturn else entryReturnLoss[1];
def entryFPLWins = if isWin then entryReturn else 0;
def entryFPLLosses = if isLoss then entryReturn else 0;
def entryFPLAll = if isLoss or isWin then entryReturn else 0;

#Counts
def entryCount = incrementValue(entryFPLAll);
def winCount = incrementValue(isWin);
def lossCount = incrementValue(isLoss);
def highestReturn = if entryReturnWin[1] > highestReturn[1] then entryReturnWin[1] else highestReturn[1];
def lowestReturn = if entryReturnLoss[1] < lowestReturn[1] then entryReturnLoss[1] else lowestReturn[1];

def winRate = if winCount == 0 and lossCount == 0 then 0 else if lossCount == 0 then 1 else winCount / lossCount;
def winLossRatio = winCount / entryCount;
def avgReturn = TotalSum(entryFPLAll) / entryCount;
def avgWin = TotalSum(entryFPLWins) / winCount;
def avgLoss = TotalSum(entryFPLLosses) / lossCount;

#Floating P/L labels
AddLabel(ShowStategyPositions,"Total Trades: " + entryCount + "  ", Color.Cyan);
AddLabel(ShowStategyPositions,"WinCount: " + winCount + " | LossCount: " + lossCount , color = if winRate >= targetWinRate then Color.Green else Color.Red);
AddLabel(ShowStategyPositions,"W/L: " + AsPercent(winLossRatio) + " ", color = if winLossRatio > targetWinLoss then Color.Green else Color.Red);
AddLabel(ShowStategyPositions,"AvgWin: "+AsDollars(avgWin)+" | AvgLoss: "+AsDollars(avgLoss),color = if TotalSum(entryFPLAll) >= 0 then color.Green else Color.Red);
AddLabel(ShowStategyPositions,"Total Profit: " + AsDollars(TotalSum(entryFPLAll)), color = if TotalSum(entryFPLAll) > 0 then Color.Green else Color.Red);
 

Attachments

  • Screaming Price.jpg
    Screaming Price.jpg
    166.1 KB · Views: 238
Last edited:
Thank you, Congamike, for this script. I'm going to show how it looks on my /ES 3000tick chart. I like to use 1000 tick chart for precise entry, while 3000 and 9000 tick for confirmation and continuation of the trend (always 1:3 fractal). Below the chart are Linear Regression slope (10period histogram, I color coded it for better visual) and Rsquared 10 period (it always must have the same period as LR to be valid). Rsquared is a lagging indicator, however, when it crosses critical value, which is .40 for this specific period, the chances of valid trade are 95%! That's pure math (I'm into applied math :)) Oh! I use TTM Trend, period of 5 to color the bars, simple and works really well). Can't wait to try it tomorrow. Marry Christmas :))))
 

Attachments

  • Screenshot 2023-12-25 at 7.13.10 AM.png
    Screenshot 2023-12-25 at 7.13.10 AM.png
    301 KB · Views: 132
Thread starter Similar threads Forum Replies Date
Jaaackjack Repaints Al Brooks Price Action Indicators For ThinkOrSwim Strategies & Chart Setups 9

Similar threads

Not the exact question you're looking for?

Start a new thread and receive assistance from our community.

87k+ Posts
506 Online
Create Post

Similar threads

Similar threads

The Market Trading Game Changer

Join 2,500+ subscribers inside the useThinkScript VIP Membership Club
  • Exclusive indicators
  • Proven strategies & setups
  • Private Discord community
  • ‘Buy The Dip’ signal alerts
  • Exclusive members-only content
  • Add-ons and resources
  • 1 full year of unlimited support

Frequently Asked Questions

What is useThinkScript?

useThinkScript is the #1 community of stock market investors using indicators and other tools to power their trading strategies. Traders of all skill levels use our forums to learn about scripting and indicators, help each other, and discover new ways to gain an edge in the markets.

How do I get started?

We get it. Our forum can be intimidating, if not overwhelming. With thousands of topics, tens of thousands of posts, our community has created an incredibly deep knowledge base for stock traders. No one can ever exhaust every resource provided on our site.

If you are new, or just looking for guidance, here are some helpful links to get you started.

What are the benefits of VIP Membership?
VIP members get exclusive access to these proven and tested premium indicators: Buy the Dip, Advanced Market Moves 2.0, Take Profit, and Volatility Trading Range. In addition, VIP members get access to over 50 VIP-only custom indicators, add-ons, and strategies, private VIP-only forums, private Discord channel to discuss trades and strategies in real-time, customer support, trade alerts, and much more. Learn all about VIP membership here.
How can I access the premium indicators?
To access the premium indicators, which are plug and play ready, sign up for VIP membership here.
Back
Top