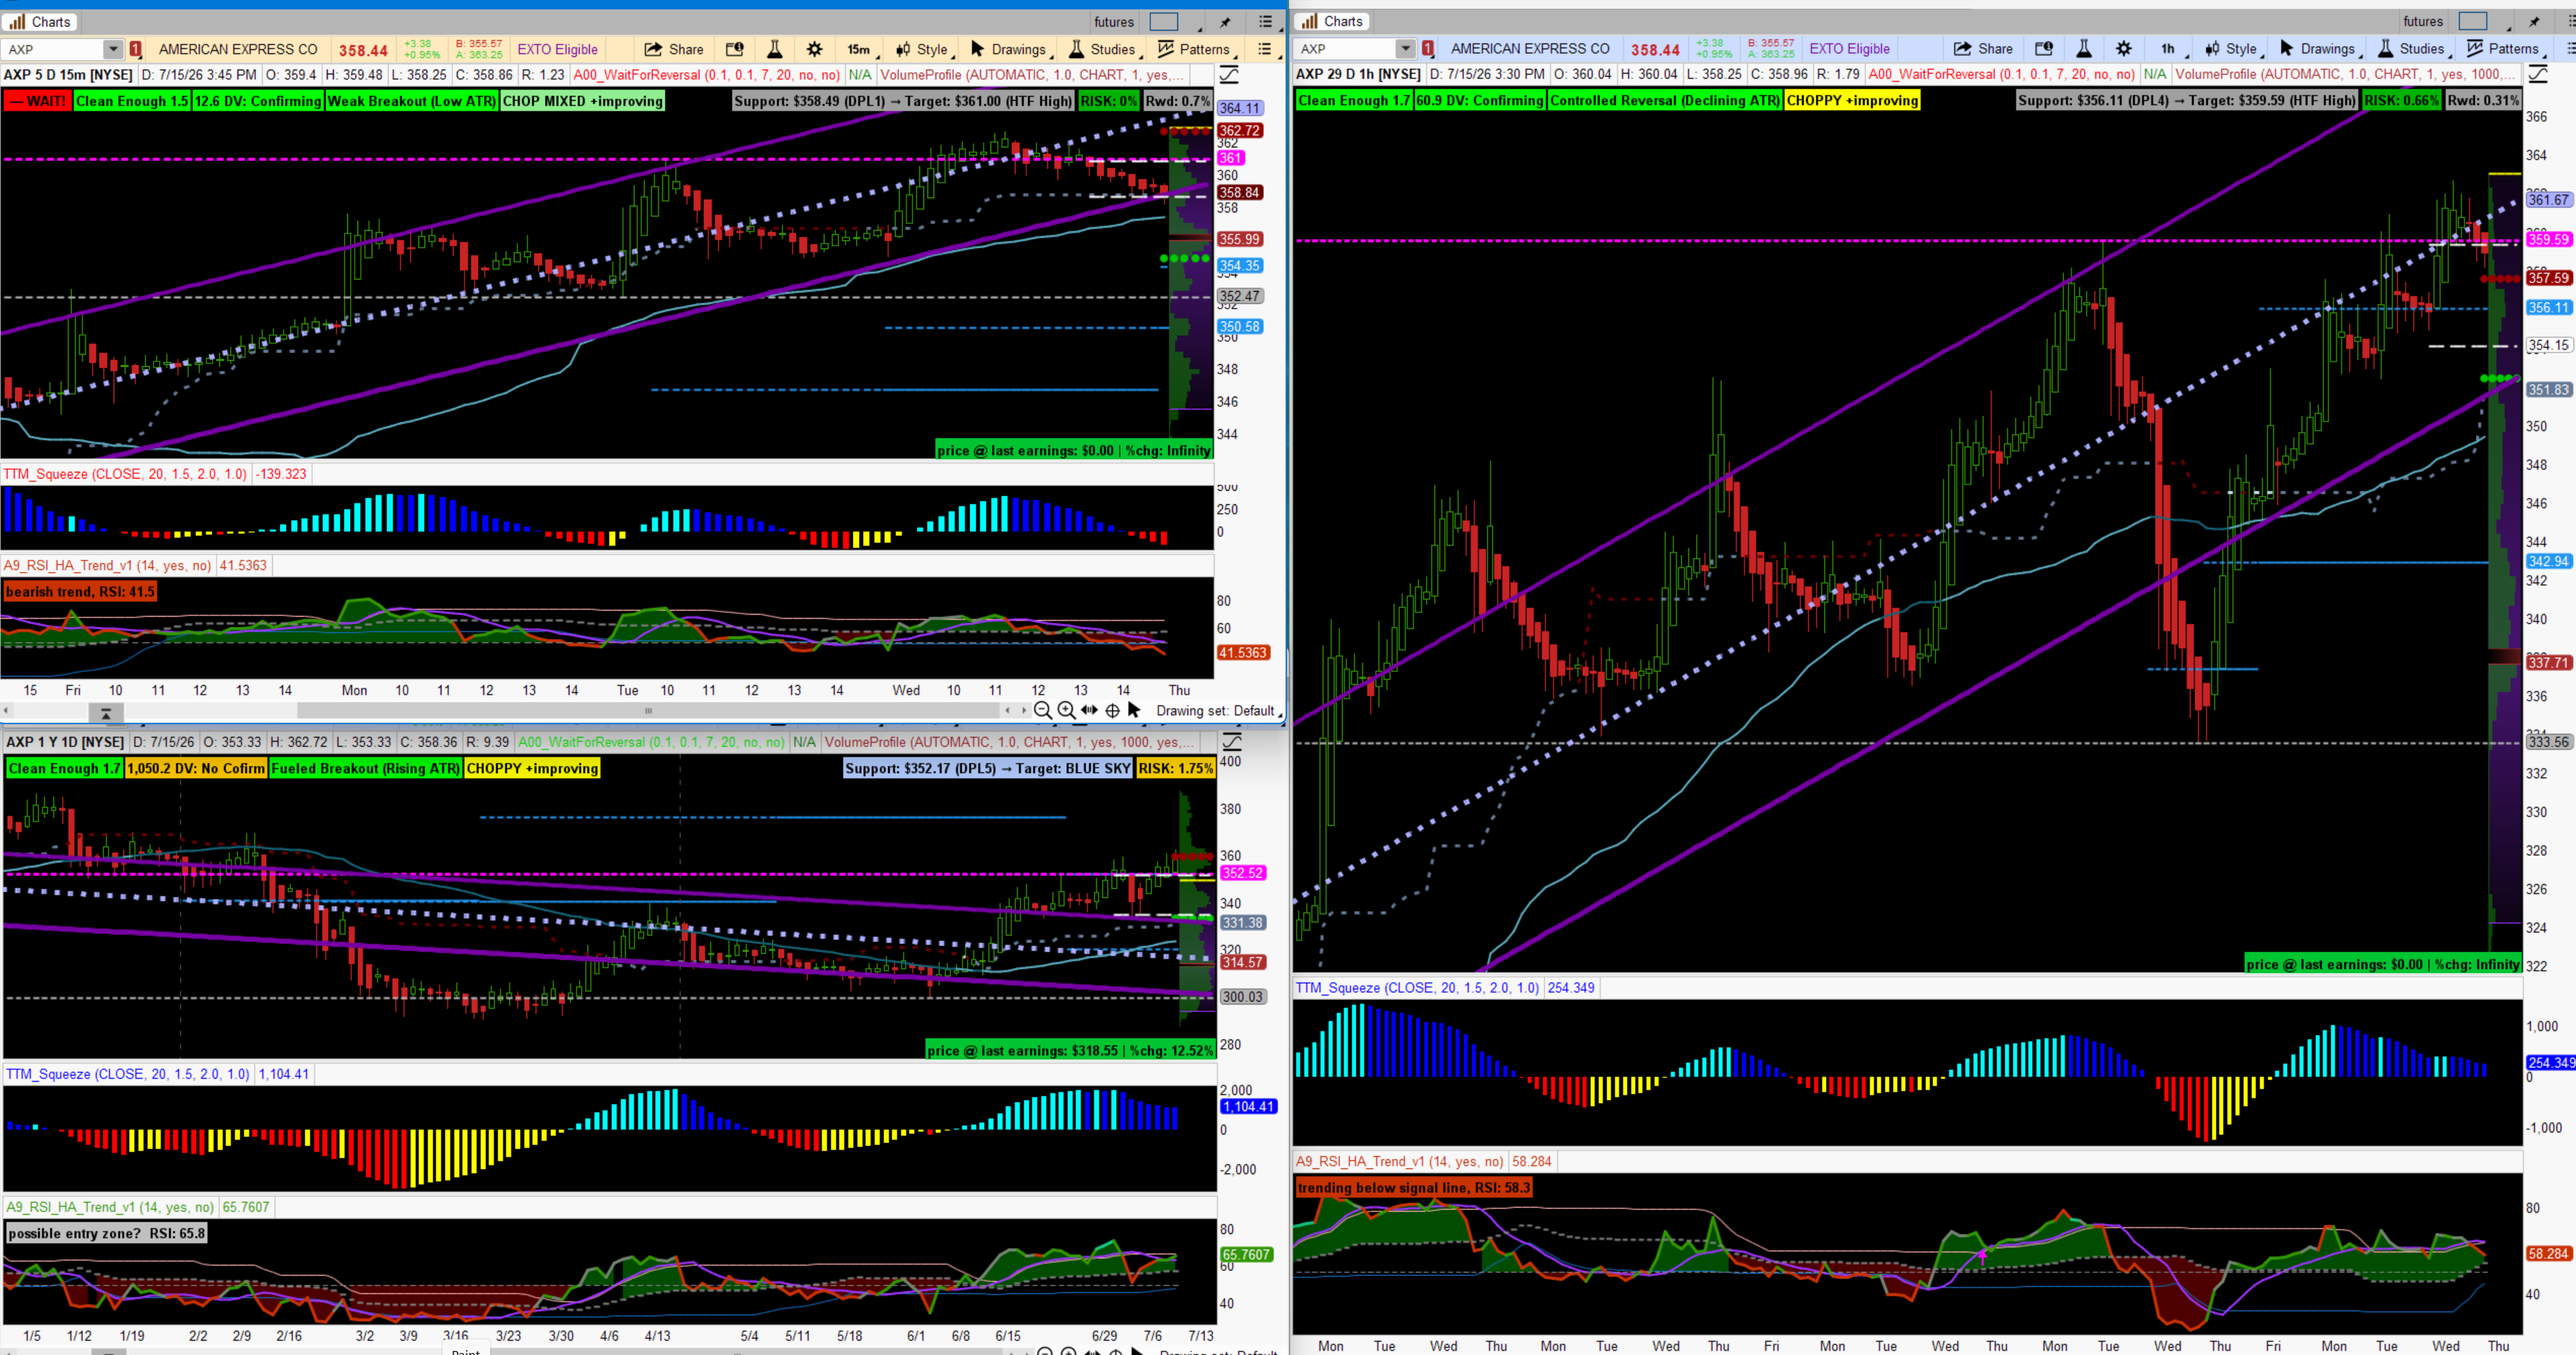
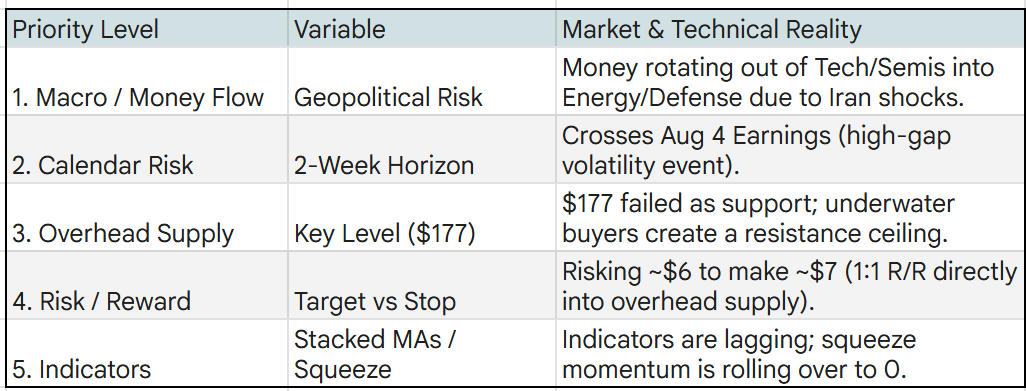
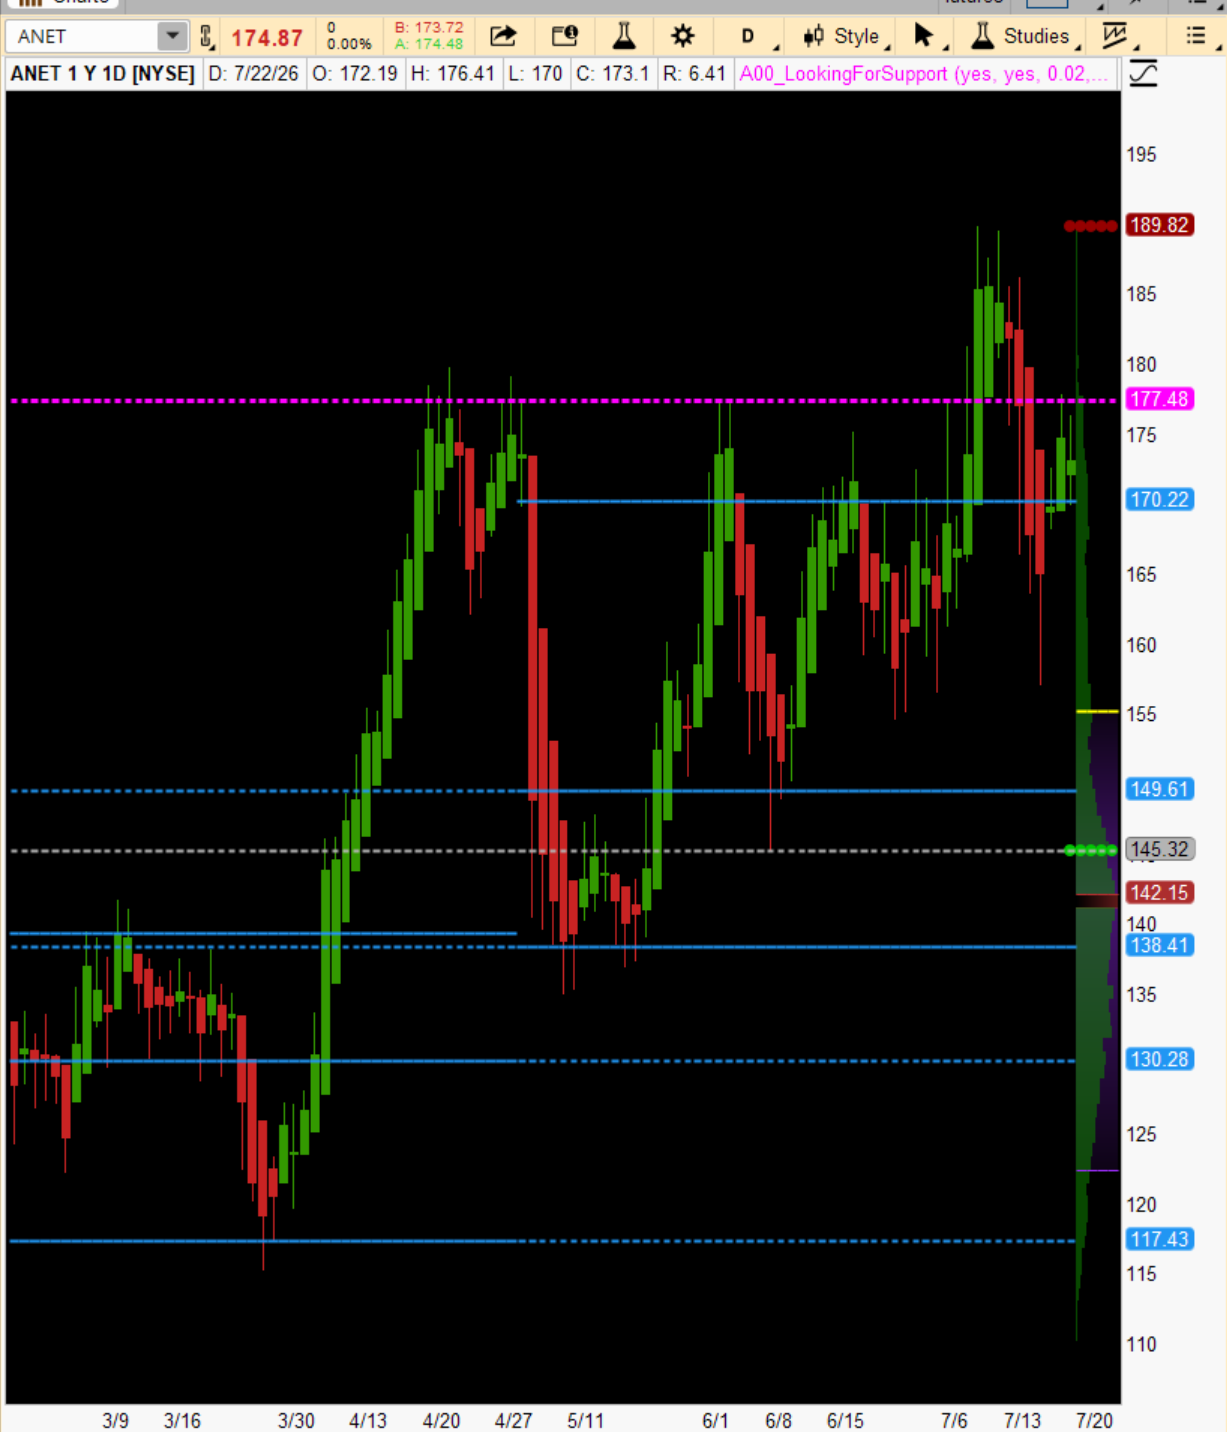
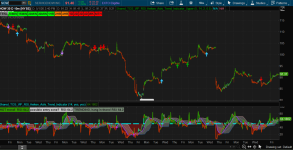
I was tracking NOW for past couple of days and I missed the jumped.
Is it possible to have RSI-HA scanner please???
https://usethinkscript.com/threads/rsi-ha-trend.19862/
I am a swing trader utilizing a multi-timeframe approach that combines trend alignment, momentum squeezes, and structured price channels to identify high-probability setups.
1. Trend Selection & Screening Moving Averages: I scan the daily timeframe for a stacked Exponential Moving Average (EMA) alignment (8 EMA > 21 EMA > 34 EMA > 55 EMA) to confirm a strong bullish trend.
Momentum Indicator: The TTM Squeeze must be active (on), and the momentum histogram must be positive (above the zero line).
Structural Filter: I use a Linear Regression Channel within my scanning parameters to define the overarching market structure and boundaries.
2. Trade Execution & Risk Management
Trade Entry (Buy): I enter long positions on the daily chart when the price pulls back near the 1 Average True Range (ATR) band.
Trade Exit (Sell): I take profits when the price expands to target zones between the 2 and 3 ATR bands on the daily chart.
Multi-Timeframe Refinement: While setup selection happens on the daily timeframe, I always analyze the 1-hour and 15-minute charts to refine my entries, exits, and execution decisions.
Scan - http://tos.mx/!FAsyQV6b
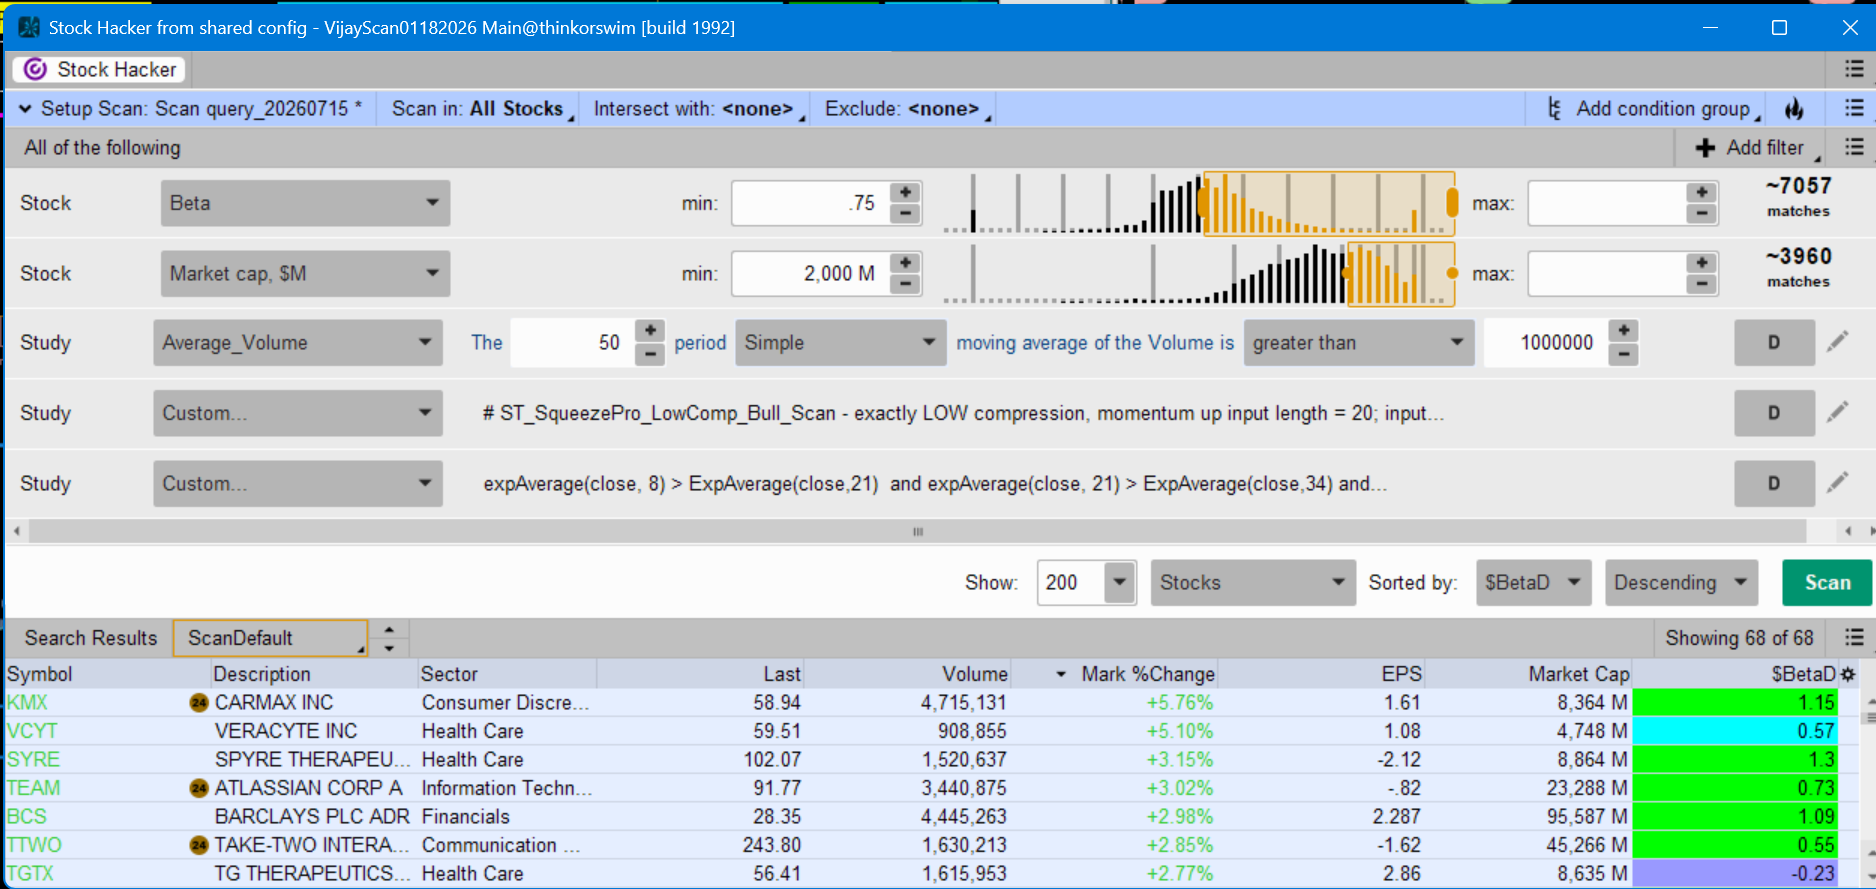
Scan result- AXP exhibits a highly favorable setup and meets all criteria for our trading strategy.
The RSI-HA (Heikin Ashi) indicator will integrate volume analysis and RSI momentum thresholds into the scanning criteria.
Is it possible to have RSI-HA scanner please???
https://usethinkscript.com/threads/rsi-ha-trend.19862/
I am a swing trader utilizing a multi-timeframe approach that combines trend alignment, momentum squeezes, and structured price channels to identify high-probability setups.
1. Trend Selection & Screening Moving Averages: I scan the daily timeframe for a stacked Exponential Moving Average (EMA) alignment (8 EMA > 21 EMA > 34 EMA > 55 EMA) to confirm a strong bullish trend.
Momentum Indicator: The TTM Squeeze must be active (on), and the momentum histogram must be positive (above the zero line).
Structural Filter: I use a Linear Regression Channel within my scanning parameters to define the overarching market structure and boundaries.
2. Trade Execution & Risk Management
Trade Entry (Buy): I enter long positions on the daily chart when the price pulls back near the 1 Average True Range (ATR) band.
Trade Exit (Sell): I take profits when the price expands to target zones between the 2 and 3 ATR bands on the daily chart.
Multi-Timeframe Refinement: While setup selection happens on the daily timeframe, I always analyze the 1-hour and 15-minute charts to refine my entries, exits, and execution decisions.
Scan - http://tos.mx/!FAsyQV6b
Scan result- AXP exhibits a highly favorable setup and meets all criteria for our trading strategy.
The RSI-HA (Heikin Ashi) indicator will integrate volume analysis and RSI momentum thresholds into the scanning criteria.
Attachments
Last edited by a moderator: