You should upgrade or use an alternative browser.
price is above or below premarket high or low watchlist
- Thread starter Khahuy12
- Start date
sorry for that mistake
i think this will do it
# prehighlow_col_01

# -------------------
# halcyonguy
# 21-06-15
# column study. find highest and lowest in premarket, and compare to daytime highs/lows
# -------------------

# https://usethinkscript.com/threads/pm-high-low-on-watchlist.6893/
#khahuy12
#can someone create a premarket high low on watchlist? if current price greater then PM high then color green else red on watchlist?

input start = 0930;
input end = 1600;
# is current bar during normal trading hours?
def daytime = if secondsfromTime(start) >= 0 and secondstillTime(end) > 0 then 1 else 0;

def prehi =
  # starting pre, reset
  if  daytime[1] and !daytime then high
  # if a higher high, set it to var
  else if !daytime and high > prehi[1] then high
  # else keep previous value
  else prehi[1];

def prelo =
  # starting pre, reset
  if  daytime[1] and !daytime then low
  # if a lower low, set it to var
  else if !daytime and low < prelo[1] then low
  # else keep previous value
  else prelo[1];

def dayhigher = ( high > prehi );
def daylower = ( low < prelo );

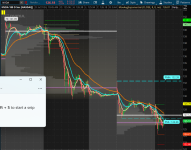
addlabel(1, (if close > prehi then ((close - prehi) + " above pre hi")
else if close < prelo then ((prelo - close) + " below pre low") else "in pre rng"), color.white);

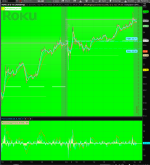
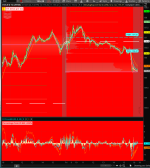
assignbackgroundcolor( if dayhigher then color.green else if daylower then color.red else color.current );

# -----------------
# test data for upper study
#input show_test_data = no;
#addlabel( show_test_data , "pre high= " + prehi, color.yellow);
#addlabel( show_test_data , "pre low= " + prelo, color.yellow);
#Join useThinkScript to post your question to a community of 21,000+ developers and traders.
prap4stocks
Member
Thanks in advance
i don't think so. a chart study can only read data from visible bars.Hi @halcyonguy is there a way to show this on chart without enabling "Extended hours" on chart ?
Thanks in advance
I have tried various scripts that have been posted but none seem to do what I want them to do. Which is create a watchlist Column thinkscript that tells you if the price is above or below premarket high or low with a simple red color for below premarket low or green for above the premarket high after the open between 930 and 1400. Can anybody help me?
Installed the script in columns on both my watchlists but no luck. Using this script on the chart to determine Premarket H/L:
declare hide_on_daily;

input length = 1;
input showOnlyLastPeriod = yes;
input ShowBubbles = yes;
input locate_bubbles_at = {default Expansion, Time};
input locate_bubbles_at_time = 800;
input BarsFromExpansion = 1;
input ShowPricesInBubbles = yes;

def bn = BarNumber();
def na = Double.NaN;
def h = high;
def l = low;
def o = open;
def c = close;
def v = volume;
def aggregationPeriod = AggregationPeriod.DAY;
def displace = -1;
def timeopen = SecondsFromTime(locate_bubbles_at_time) == 0;
def isExpansion = locate_bubbles_at == locate_bubbles_at.Expansion and IsNaN(close);
def firstExpansionBar = if !IsNaN(close[-1]) and isExpansion then 1 else if isExpansion then firstExpansionBar[1] + 1 else 0;
def BubbleLocation = if locate_bubbles_at == locate_bubbles_at.Time then timeopen else isExpansion and firstExpansionBar == BarsFromExpansion;


def GlobeX = GetTime() < RegularTradingStart(GetYYYYMMDD());

def vol = if GlobeX and !GlobeX[1]
then v
else if GlobeX
then vol[1] + v
else na;

def GlobeX_Volume = vol;

def ONhigh = if GlobeX and !GlobeX[1]
then h
else if GlobeX and
h > ONhigh[1]
then h
else ONhigh[1];

def ONhighBar = if GlobeX and h == ONhigh
then bn
else na;

def ONlow = if GlobeX and !GlobeX[1]
then l
else if GlobeX and
l < ONlow[1]
then l
else ONlow[1];

def ONlowBar = if GlobeX and l == ONlow
then bn
else na;

def OverNightHigh = if BarNumber() == HighestAll(ONhighBar)
then ONhigh
else OverNightHigh[1];

def OverNightLow = if BarNumber() == HighestAll(ONlowBar)
then ONlow
else OverNightLow[1];

plot PM_High;
plot PM_Low;
if showOnlyLastPeriod and !IsNaN(close(period = aggregationPeriod)[-1]) {
PM_High = na;
PM_Low = na;
} else {
PM_High = if OverNightHigh > 0 then OverNightHigh else na;
PM_Low = if OverNightLow > 0 then OverNightLow else na;
}

#PM_High.SetHiding(!PlotOverNightExtremes);
PM_High.SetLineWeight(2);
PM_High.SetDefaultColor(Color.CYAN);
PM_High.SetStyle(Curve.LONG_DASH);
PM_High.HideBubble();
PM_High.HideTitle();

#PM_Low.SetHiding(!PlotOverNightExtremes);
PM_Low.SetStyle(Curve.LONG_DASH);
PM_Low.SetDefaultColor(Color.CYAN);
PM_Low.HideBubble();
PM_Low.HideTitle();

DefineGlobalColor("PM_High", CreateColor(102, 255, 255));
AddChartBubble(ShowBubbles and if locate_bubbles_at == locate_bubbles_at.Time then bn == ONhighBar else isExpansion and firstExpansionBar == BarsFromExpansion, PM_High, "PMH: " + (if ShowPricesInBubbles then AsText(PM_High) else ""), GlobalColor("PM_High"));

DefineGlobalColor("PM_Low", CreateColor(102, 255, 255));
AddChartBubble(ShowBubbles and if locate_bubbles_at == locate_bubbles_at.Time then bn == ONlowBar else isExpansion and firstExpansionBar == BarsFromExpansion, PM_Low, "PML: " + (if ShowPricesInBubbles then AsText(PM_Low) else ""), GlobalColor("PM_Low"), no);
So far I haven't found any useful codes that work for the watchlist column, I even tried getting co-pilot AI to write something.
Copilot
Yes, you can create a ThinkScript for a watchlist column that indicates if the current price is above or below the premarket high or low. Here’s an example of how you can do it:
# Define the color rules
def color;
if close < PM_Low then {
    color = Color.RED;
} else if close > PM_High then {
    color = Color.GREEN;
} else {
    color = Color.YELLOW;
}

# Add the color column
AddLabel(yes, "PreMkt", color);
In this script, AddLabel adds a label to your watchlist column that changes color based on the current closing price in relation to the premarket high and low. If the closing price is below the premarket low, the label will be red. If it’s above the premarket high, the label will be green. If the price is between the premarket high and low, the label will be yellow1.
Please note that you should add this code at the end of your existing script. Also, make sure to replace close with the appropriate price variable in your script. In your provided script, close represents the closing price. If you want to use a different price (like the opening price or the high price), you should replace close with the appropriate variable (open for the opening price, high for the high price, etc.).
Remember to test the script in a demo environment before using it in live trading to ensure it works as expected. If you encounter any issues, feel free to ask for further assistance. Happy trading!
Also used ChatGPt: Results
# Define Inputsinput premarketLength = 60; # Length of time in minutes for premarket data# Calculate premarket high and lowdef premarketHigh = highest(high(period = "day")[premarketLength]);def premarketLow = lowest(low(period = "day")[premarketLength]);# Determine if current price is above or below premarket high or lowdef isAbovePremarketHigh = close > premarketHigh;def isBelowPremarketLow = close < premarketLow;# Assign color based on conditionsAssignBackgroundColor(if isAbovePremarketHigh then Color.GREEN else if isBelowPremarketLow then Color.RED else Color.CURRENT);# Plot text in watchlist columnAddLabel(yes, if isAbovePremarketHigh then "Above PM High" else if isBelowPremarketLow then "Below PM Low" else "Within PM Range", if isAbovePremarketHigh then Color.GREEN else if isBelowPremarketLow then Color.RED else Color.CURRENT);None of these have worked. Anybody in the group who can help with this will surely be appreciated.
Thanks Morris
Attachments
Re: Create a watchlist Column thinkscript that tells you if the price is above or below premarket high or low?
I have tried various scripts that have been posted but none seem to do what I want them to do. Which is create a watchlist Column thinkscript that tells you if the price is above or below premarket high or low with a simple red color for below premarket low or green for above the premarket high after the open between 930 and 1400. Can anybody help me?
None of these have worked. Anybody in the group who can help with this will surely be appreciated.
Thanks Morris
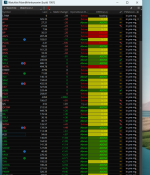
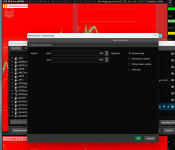
the code in post#2 of this thread by halcyonguy works fine however its for all of extended hours. if you want it to be for ONLY PREMARKET then to fix that you just change the time input. this will make it so it just scans the premarket high/low rather than the entire extended hours. his code will also change colors like you want and works as a column. if you want colors change you can edit the code to change the colors to your liking or to change the text in the label, which i assume is pretty straight forward for most people.
REMEMBER to SET THE AGGREGATION to 1 minute and to check the EXTENDED HOURS box.
for just pre-market change the following lines from post #2 of this thread.
change:
input start = 0930;
input end = 1600;
to:
input start = 0930;
input end = 1959;Attachments
in "in pre rng" means thats the current closing price is within the pre market range meaning its inbetween the premarket high and the premarket low.
you should familiarize yourself with tos columns by watching YouTube videos.
SET THE AGGREGATION to 1 minute and to check the EXTENDED HOURS box.,
You can't do that in this script, it must be done in the column settings
Similar threads
-
-
-
-
-
Can I plot small 1 minute length lines above and below current price that represent 1%, 2%, 3% and so on.
- Started by Thane313
- Replies: 2
Not the exact question you're looking for?
Start a new thread and receive assistance from our community.
Similar threads
-
-
-
-
-
Can I plot small 1 minute length lines above and below current price that represent 1%, 2%, 3% and so on.
- Started by Thane313
- Replies: 2
Similar threads
-
-
-
-
-
Can I plot small 1 minute length lines above and below current price that represent 1%, 2%, 3% and so on.
- Started by Thane313
- Replies: 2
The Market Trading Game Changer
- Exclusive indicators
- Proven strategies & setups
- Private Discord community
- ‘Buy The Dip’ signal alerts
- Exclusive members-only content
- Add-ons and resources
- 1 full year of unlimited support
Frequently Asked Questions
useThinkScript is the #1 community of stock market investors using indicators and other tools to power their trading strategies. Traders of all skill levels use our forums to learn about scripting and indicators, help each other, and discover new ways to gain an edge in the markets.
We get it. Our forum can be intimidating, if not overwhelming. With thousands of topics, tens of thousands of posts, our community has created an incredibly deep knowledge base for stock traders. No one can ever exhaust every resource provided on our site.
If you are new, or just looking for guidance, here are some helpful links to get you started.
- The most viewed thread:
https://usethinkscript.com/threads/repainting-trend-reversal-for-thinkorswim.183/ - Our most popular indicator:
https://usethinkscript.com/threads/buy-the-dip-indicator-for-thinkorswim.3553/ - Answers to frequently asked questions:
https://usethinkscript.com/threads/answers-to-commonly-asked-questions.6006/

