Watchlist column indicating if Price is Above or Below the open of candle on Quarter / Month / Week / Day
I'm trying to figure out a way to add a custom column in watchlists that can indicate whether the current price is above or below the open of the candle for the following timeframes: Quarter, Month, Week, and Day.
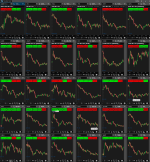
I have labels on my chart that indicate that and I've made a big flexible grid with those labels on each stock I watch, but I'm hoping I can simplify this by using a watchlist with these custom columns in it and then I can search through many more stocks that meet my criteria.
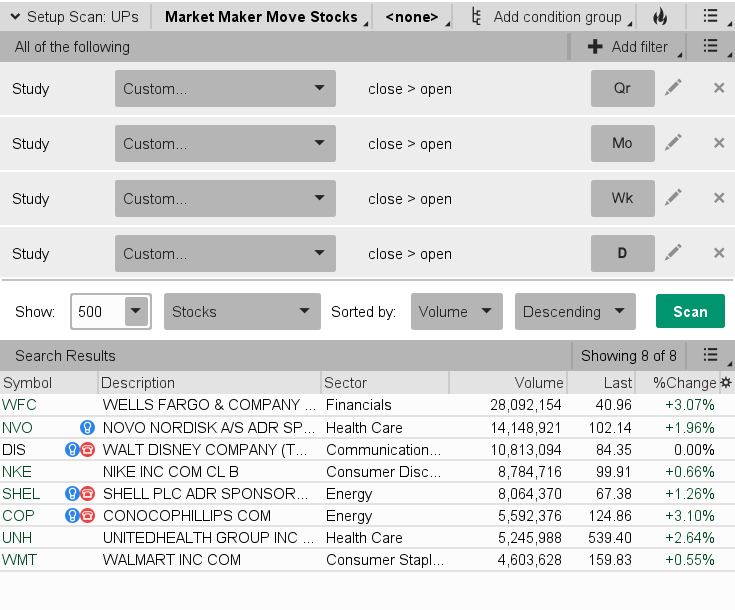
Alternatively, is it possible to build a scan using this criteria? Then I could create a watchlist from that scan and accomplish the same thing, I just prefer the visual aspect of seeing the columns lit with either green or red indicating above or below the open of each timeframe.
Any help much appreciated! Pic attached of my flex grid with labels showing me if price is above the open of Q/M/W/D
Ideally I’d like just 1 column that lights up Green if price is above all 4 opens or Red if below all 4 opens.
The ToS platform does not allow multiple timeframes to be used in the scan hacker, watchlists, conditional orders, or any other widget...
Multiple timeframes may only be used for chart labels and chart plots.
It is because of the fundamental way that the widgets works.
Before you start to create the watchlist, you choose the aggregation period.
It is locked in.
Then it pulls data for that aggregation only; to run the code.
It is the only timeframe that it is pulling data for.
If the script references another aggregation, the script will not run and it will vomit the error:
"secondary aggregations not allowed".
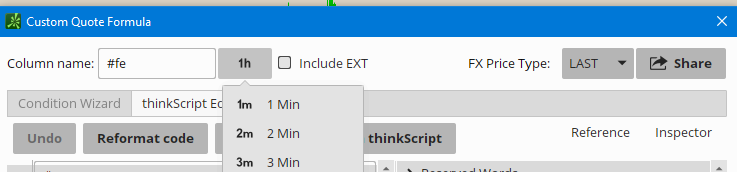
Oh! Could you walk me thru that or screen shot maybe? I tried to do that by using the daily open study and changing the aggregation to week or month and it wouldn’t work for me but maybe I wasn’t doing it right?
Oh! Could you walk me thru that or screen shot maybe? I tried to do that by using the daily open study and changing the aggregation to week or month and it wouldn’t work for me but maybe I wasn’t doing it right?
Watchlist column indicating if Price is Above or Below the open of candle on Quarter / Month / Week / Day
I'm trying to figure out a way to add a custom column in watchlists that can indicate whether the current price is above or below the open of the candle for the following timeframes: Quarter, Month, Week, and Day.
I have labels on my chart that indicate that and I've made a big flexible grid with those labels on each stock I watch, but I'm hoping I can simplify this by using a watchlist with these custom columns in it and then I can search through many more stocks that meet my criteria.
Alternatively, is it possible to build a scan using this criteria? Then I could create a watchlist from that scan and accomplish the same thing, I just prefer the visual aspect of seeing the columns lit with either green or red indicating above or below the open of each timeframe.
Any help much appreciated! Pic attached of my flex grid with labels showing me if price is above the open of Q/M/W/D
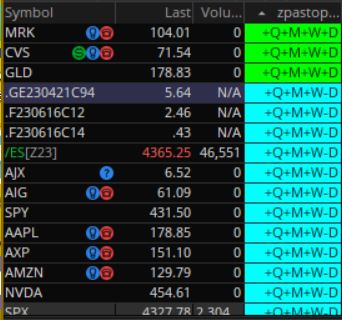
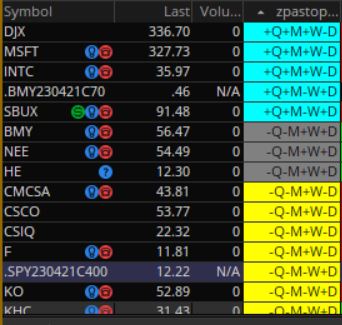
this is a column study,
that displays + or - to show if the current price is greater than or less than 4 previous opens,
the day open, week open, month open, quarter open.
it displays something like this, with + or -, for each time
ex. +Q-M-W+D
the color of the cell depends on the quantity of + signs.
green , if all 4 are +
cyan , if 3 are +
gray , if 2
yellow , if 3 are -
red , if all 4 are -
clicking on the column header will sort it and group the colors.
set the time to day
it doesn't use 2nd aggregation. it reads an open value and keeps it till the last bar.
it looks for and skips monday holidays.
#zpastopens

# set column study to day

#mtf4_opens_compare_upper
#https://usethinkscript.com/threads/price-is-above-or-below-the-open-of-candle.16934/#post-132813
#Price is Above or Below the open of candle

# watchlist,  the current price is above or below the open of the candle for the following timeframes:
#  Quarter, Month, Week, and Day.   Q/M/W/D

def na = Double.NaN;
def bn = BarNumber();

def dow = GetDayOfWeek(GetYYYYMMDD());
def dom = GetDayOfMonth(GetYYYYMMDD());
def mo = GetMonth();

# find 1st day of a series
def wk_one = (dow < dow[1]);
def mo_one = (dom < dom[1]);
def qtr_one = (mo == 1 and dom < dom[1] or mo == 4 and dom < dom[1] or mo == 7 and dom < dom[1] or mo == 10 and dom < dom[1] );

# get open from 1st day of
def dy_o = open;
def wk_o = if wk_one then open else wk_o[1];
def mo_o = if mo_one then open else mo_o[1];
def qtr_o = if qtr_one then open else qtr_o[1];

# diff of price - (a past open)
def dy_diff = close - dy_o;
def wk_diff = close - wk_o;
def mo_diff = close - mo_o;
def qtr_diff = close - qtr_o;

def dy_up = dy_diff > 0;
def wk_up = wk_diff > 0;
def mo_up = mo_diff > 0;
def qtr_up = qtr_diff > 0;

def upsum = (dy_up + wk_up + mo_up + qtr_up);


# Q|M|W|D

addlabel(1,
((if qtr_up then "+Q" else "-Q") +
 (if mo_up then "+M" else "-M") +
 (if wk_up then "+W" else "-W") +
 (if dy_up then "+D" else "-D")),
color.black);

assignbackgroundcolor(
if upsum == 4 then color.green
else if upsum == 0 then color.red
else if upsum == 3 then color.cyan
else if upsum == 1 then color.yellow
else color.gray);


addchartbubble(0, low,
#mo + " mo\n" +
wk_one + " wk\n" +
mo_one + " mo\n" +
qtr_one + " Q\n" +
dy_o + " dy\n" +
wk_o + " wk\n" +
mo_o + " mo\n" +
qtr_o + " Q"
, (
if qtr_one then color.green else if mo_one then color.cyan else if wk_one then color.yellow else color.gray), no);

#if all + then green
#if all - then red
#else
#---  yellow
#+++  cyan
#-- or ++ gray
#
show QMWD , with + or -,
to indicate if price is > or < a previous open
-------------------------------------
test study - upper
set to day
Code:
#mtf4_opens_compare_upper

#https://usethinkscript.com/threads/price-is-above-or-below-the-open-of-candle.16934/#post-132813
#Price is Above or Below the open of candle
#Jaaackjack  10/15

#Watchlist column indicating if Price is Above or Below the open of candle on Quarter / Month / Week / Day

#I'm trying to figure out a way to add a custom column in watchlists that can indicate whether the current price is above or below the open of the candle for the following timeframes: Quarter, Month, Week, and Day.


#halcyonguy said:
#if you want 4 column studies, then copy your label code... post the code
#or do you want 1 column study, to somehow display 4 variables?


#I tried to do that but it wasn’t working when I tried to add that study into a column. I can post the code once I get back to my computer.
#Ideally I’d like just 1 column that lights up Green if price is above all 4 opens or Red if below all 4 opens.
# Q/M/W/D

# set to day

def na = Double.NaN;
def bn = BarNumber();

def dow = GetDayOfWeek(GetYYYYMMDD());
def dom = GetDayOfMonth(GetYYYYMMDD());
def mo = GetMonth();

# find 1st day of a series
def wk_one = (dow < dow[1]);
def mo_one = (dom < dom[1]);
def qtr_one = (mo == 1 and dom < dom[1] or mo == 4 and dom < dom[1] or mo == 7 and dom < dom[1] or mo == 10 and dom < dom[1] );

# get open from 1st day of
def dy_o = open;
def wk_o = if wk_one then open else wk_o[1];
def mo_o = if mo_one then open else mo_o[1];
def qtr_o = if qtr_one then open else qtr_o[1];

# diff of price - (a past open)
def dy_diff = close - dy_o;
def wk_diff = close - wk_o;
def mo_diff = close - mo_o;
def qtr_diff = close - qtr_o;

def dy_up = dy_diff > 0;
def wk_up = wk_diff > 0;
def mo_up = mo_diff > 0;
def qtr_up = qtr_diff > 0;

def upsum = (dy_up + wk_up + mo_up + qtr_up);


# Q|M|W|D

addlabel(1,
((if qtr_up then "+Q" else "-Q") +
 (if mo_up then "+M" else "-M") +
 (if wk_up then "+W" else "-W") +
 (if dy_up then "+D" else "-D")),
(if upsum == 4 then color.green
else if upsum == 0 then color.red
else if upsum == 3 then color.cyan
else if upsum == 1 then color.yellow
else color.gray));


addchartbubble(1, low,
#mo + " mo\n" +
wk_one + " wk\n" +
mo_one + " mo\n" +
qtr_one + " Q\n" +
dy_o + " dy\n" +
wk_o + " wk\n" +
mo_o + " mo\n" +
qtr_o + " Q"
, (
if qtr_one then color.green else if mo_one then color.cyan else if wk_one then color.yellow else color.gray), no);

#if all + then green
#if all - then red
#else
#---  yellow
#+++  cyan
#-- or ++ gray
#
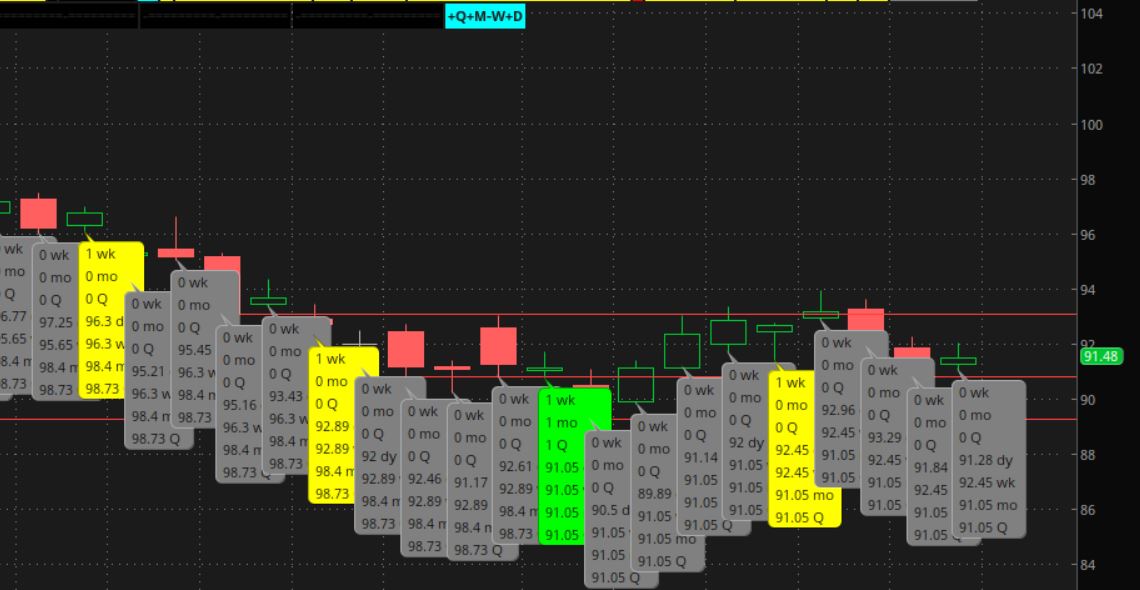
a label shows the same data as the column
test bubbles show, 1 if 1st day of a period and price values
this is a column study,
that displays + or - to show if the current price is greater than or less than 4 previous opens,
the day open, week open, month open, quarter open.
it displays something like this, with + or -, for each time
ex. +Q-M-W+D
the color of the cell depends on the quantity of + signs.
green , if all 4 are +
cyan , if 3 are +
gray , if 2
yellow , if 3 are -
red , if all 4 are -
clicking on the column header will sort it and group the colors.
set the time to day
it doesn't use 2nd aggregation. it reads an open value and keeps it till the last bar.
it looks for and skips monday holidays.
#zpastopens

# set column study to day

#mtf4_opens_compare_upper
#https://usethinkscript.com/threads/price-is-above-or-below-the-open-of-candle.16934/#post-132813
#Price is Above or Below the open of candle

# watchlist,  the current price is above or below the open of the candle for the following timeframes:
#  Quarter, Month, Week, and Day.   Q/M/W/D

def na = Double.NaN;
def bn = BarNumber();

def dow = GetDayOfWeek(GetYYYYMMDD());
def dom = GetDayOfMonth(GetYYYYMMDD());
def mo = GetMonth();

# find 1st day of a series
def wk_one = (dow < dow[1]);
def mo_one = (dom < dom[1]);
def qtr_one = (mo == 1 and dom < dom[1] or mo == 4 and dom < dom[1] or mo == 7 and dom < dom[1] or mo == 10 and dom < dom[1] );

# get open from 1st day of
def dy_o = open;
def wk_o = if wk_one then open else wk_o[1];
def mo_o = if mo_one then open else mo_o[1];
def qtr_o = if qtr_one then open else qtr_o[1];

# diff of price - (a past open)
def dy_diff = close - dy_o;
def wk_diff = close - wk_o;
def mo_diff = close - mo_o;
def qtr_diff = close - qtr_o;

def dy_up = dy_diff > 0;
def wk_up = wk_diff > 0;
def mo_up = mo_diff > 0;
def qtr_up = qtr_diff > 0;

def upsum = (dy_up + wk_up + mo_up + qtr_up);


# Q|M|W|D

addlabel(1,
((if qtr_up then "+Q" else "-Q") +
 (if mo_up then "+M" else "-M") +
 (if wk_up then "+W" else "-W") +
 (if dy_up then "+D" else "-D")),
color.black);

assignbackgroundcolor(
if upsum == 4 then color.green
else if upsum == 0 then color.red
else if upsum == 3 then color.cyan
else if upsum == 1 then color.yellow
else color.gray);


addchartbubble(0, low,
#mo + " mo\n" +
wk_one + " wk\n" +
mo_one + " mo\n" +
qtr_one + " Q\n" +
dy_o + " dy\n" +
wk_o + " wk\n" +
mo_o + " mo\n" +
qtr_o + " Q"
, (
if qtr_one then color.green else if mo_one then color.cyan else if wk_one then color.yellow else color.gray), no);

#if all + then green
#if all - then red
#else
#---  yellow
#+++  cyan
#-- or ++ gray
#
show QMWD , with + or -,
to indicate if price is > or < a previous open
-------------------------------------
test study - upper
set to day
Code:
#mtf4_opens_compare_upper

#https://usethinkscript.com/threads/price-is-above-or-below-the-open-of-candle.16934/#post-132813
#Price is Above or Below the open of candle
#Jaaackjack  10/15

#Watchlist column indicating if Price is Above or Below the open of candle on Quarter / Month / Week / Day

#I'm trying to figure out a way to add a custom column in watchlists that can indicate whether the current price is above or below the open of the candle for the following timeframes: Quarter, Month, Week, and Day.


#halcyonguy said:
#if you want 4 column studies, then copy your label code... post the code
#or do you want 1 column study, to somehow display 4 variables?


#I tried to do that but it wasn’t working when I tried to add that study into a column. I can post the code once I get back to my computer.
#Ideally I’d like just 1 column that lights up Green if price is above all 4 opens or Red if below all 4 opens.
# Q/M/W/D

# set to day

def na = Double.NaN;
def bn = BarNumber();

def dow = GetDayOfWeek(GetYYYYMMDD());
def dom = GetDayOfMonth(GetYYYYMMDD());
def mo = GetMonth();

# find 1st day of a series
def wk_one = (dow < dow[1]);
def mo_one = (dom < dom[1]);
def qtr_one = (mo == 1 and dom < dom[1] or mo == 4 and dom < dom[1] or mo == 7 and dom < dom[1] or mo == 10 and dom < dom[1] );

# get open from 1st day of
def dy_o = open;
def wk_o = if wk_one then open else wk_o[1];
def mo_o = if mo_one then open else mo_o[1];
def qtr_o = if qtr_one then open else qtr_o[1];

# diff of price - (a past open)
def dy_diff = close - dy_o;
def wk_diff = close - wk_o;
def mo_diff = close - mo_o;
def qtr_diff = close - qtr_o;

def dy_up = dy_diff > 0;
def wk_up = wk_diff > 0;
def mo_up = mo_diff > 0;
def qtr_up = qtr_diff > 0;

def upsum = (dy_up + wk_up + mo_up + qtr_up);


# Q|M|W|D

addlabel(1,
((if qtr_up then "+Q" else "-Q") +
 (if mo_up then "+M" else "-M") +
 (if wk_up then "+W" else "-W") +
 (if dy_up then "+D" else "-D")),
(if upsum == 4 then color.green
else if upsum == 0 then color.red
else if upsum == 3 then color.cyan
else if upsum == 1 then color.yellow
else color.gray));


addchartbubble(1, low,
#mo + " mo\n" +
wk_one + " wk\n" +
mo_one + " mo\n" +
qtr_one + " Q\n" +
dy_o + " dy\n" +
wk_o + " wk\n" +
mo_o + " mo\n" +
qtr_o + " Q"
, (
if qtr_one then color.green else if mo_one then color.cyan else if wk_one then color.yellow else color.gray), no);

#if all + then green
#if all - then red
#else
#---  yellow
#+++  cyan
#-- or ++ gray
#
a label shows the same data as the column
test bubbles show, 1 if 1st day and price values
Watchlist column indicating if Price is Above or Below the open of candle on Quarter / Month / Week / Day
I'm trying to figure out a way to add a custom column in watchlists that can indicate whether the current price is above or below the open of the candle for the following timeframes: Quarter, Month, Week, and Day.
I have labels on my chart that indicate that and I've made a big flexible grid with those labels on each stock I watch, but I'm hoping I can simplify this by using a watchlist with these custom columns in it and then I can search through many more stocks that meet my criteria.
Alternatively, is it possible to build a scan using this criteria? Then I could create a watchlist from that scan and accomplish the same thing, I just prefer the visual aspect of seeing the columns lit with either green or red indicating above or below the open of each timeframe.
Any help much appreciated! Pic attached of my flex grid with labels showing me if price is above the open of Q/M/W/D
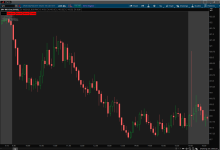
I got you homie! I call it my MTFA study. Screenshot attached too so you can see how I like to use it - definitely helps me feel confident that I am actually trading in the direction of the trend on all timeframes. Have yet to figure out my strategy though, would make sense to look for Bull Flags and Bear Flags after direction is determined for the day, assuming the day lines up with other timeframes. Best of luck!
useThinkScript is the #1 community of stock market investors using indicators and other tools to power their trading strategies. Traders of all skill levels use our forums to learn about scripting and indicators, help each other, and discover new ways to gain an edge in the markets.
How do I get started?
We get it. Our forum can be intimidating, if not overwhelming. With thousands of topics, tens of thousands of posts, our community has created an incredibly deep knowledge base for stock traders. No one can ever exhaust every resource provided on our site.
If you are new, or just looking for guidance, here are some helpful links to get you started.
VIP members get exclusive access to these proven and tested premium indicators: Buy the Dip, Advanced Market Moves 2.0, Take Profit, and Volatility Trading Range. In addition, VIP members get access to over 50 VIP-only custom indicators, add-ons, and strategies, private VIP-only forums, private Discord channel to discuss trades and strategies in real-time, customer support, trade alerts, and much more. Learn all about VIP membership here.
How can I access the premium indicators?
To access the premium indicators, which are plug and play ready, sign up for VIP membership here.