Hello Guys,
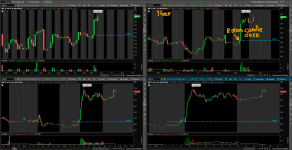
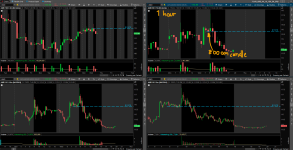
I am looking for a script for TOS that can put a horizontal line from a set time, let's say for the closing price of the 0800 am candle in the 1-hour timeframe (main timeframe), and that this line can be seen in different timeframes as in the screenshots that I attached. This line should only be drawn for the day, and the next day the line of the previous day disappears, and only the new line for 0800 am should be shown.
Thank you in advance.