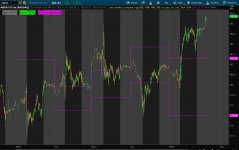
I have an indicator that show where the day's open is compared to the previous day's range.
An example, if the previous day's high (PDH) 101.0 and the previous day's low (PDL) was 100.0 and today's open was 100.5 then the value would be 50%, if open was 100.1 then 110%, if open was 99.7 the value would be -30%.

The code below works well after the market opens. But I would like to see were the price is trading relative to the previous day's range in the premarket. I need help on getting it to work in the premarket. After the open the value does not change. I would be fine using the premarket close rather than the market open, but I cannot get the PDH and PDL in the premarket. Again, once the market opens it provides works as I want it. How can I make it work in the premarket?
input showLabel = yes;
plot DailyHigh = high(period=”DAY”)[1];
plot DailyLow = low(period="Day")[1];
# Label for r/g
def price = high;
def prev_high = high(period=”DAY”)[1];
def prev_low = low(period="DAY")[1];
def openprice = open(period = ”day”)[0];
def pd_percent_open = ((openprice-prev_low)/(prev_high-prev_low));
def bullish = pd_percent_open >= .90;
def bearish = pd_percent_open <= .10;
def neutral = pd_percent_open < .90 and pd_percent_open >.10;
AddLabel(showLabel, aspercent(pd_percent_open), if bullish then Color.GREEN else if bearish then Color.RED else Color.white);
An example, if the previous day's high (PDH) 101.0 and the previous day's low (PDL) was 100.0 and today's open was 100.5 then the value would be 50%, if open was 100.1 then 110%, if open was 99.7 the value would be -30%.
The code below works well after the market opens. But I would like to see were the price is trading relative to the previous day's range in the premarket. I need help on getting it to work in the premarket. After the open the value does not change. I would be fine using the premarket close rather than the market open, but I cannot get the PDH and PDL in the premarket. Again, once the market opens it provides works as I want it. How can I make it work in the premarket?
input showLabel = yes;
plot DailyHigh = high(period=”DAY”)[1];
plot DailyLow = low(period="Day")[1];
# Label for r/g
def price = high;
def prev_high = high(period=”DAY”)[1];
def prev_low = low(period="DAY")[1];
def openprice = open(period = ”day”)[0];
def pd_percent_open = ((openprice-prev_low)/(prev_high-prev_low));
def bullish = pd_percent_open >= .90;
def bearish = pd_percent_open <= .10;
def neutral = pd_percent_open < .90 and pd_percent_open >.10;
AddLabel(showLabel, aspercent(pd_percent_open), if bullish then Color.GREEN else if bearish then Color.RED else Color.white);