Power Earnings Gaps (PEG) Scanner for ThinkorSwim

BenTen

Administrative
Staff member
Staff
VIP
Lifetime
Power Earnings Gappers (PEG) is a strategy shared by @traderstewie at Art of Trading. If you haven't check out the original article, you can do so here.

This scanner for ThinkorSwim just makes it easier to find potential stocks that have shown strong technical qualities after reporting great earnings.
Potential quality stocks that have proven themselves are worth the investment.
It was developed by Drew Griffith.
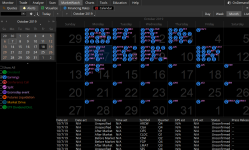
WHMwLfc.png


PEG Scanner

Rich (BB code):
#hint: SCAN (only) for "PEG" stands for power earnings gap. looking for a pullback from a previous gap and the stock is in a consolidation phase.

declare upper;
input percentage = 0.5; #hint: % gap
input wthn = 30; # periods to look for gap
def x = 1 + percentage / 100;

def cl = close;
def lo = low;
def hi = high;
def op = open;
def vo = volume;
def barnumber = BarNumber();

def gapup = lo > hi[1] * x;
def sign_up = if gapup then barnumber else 0;
def cup = (barnumber - Highest(sign_up[1], wthn));
def count_up = if barnumber <= wthn then 0 else if cup > wthn then 0 else cup;

def gapdn = hi * x < lo[1];
def sign_dn = if gapdn then barnumber else 0;
def cdn = (barnumber - Highest(sign_dn[1], wthn));
def count_dn = if barnumber <= wthn then 0 else if cdn > wthn then 0 else cdn;

input ema_10 = 10;
input ema_30 = 30;
input ema_300 = 300;

def EMA10 = MovAvgExponential(cl, ema_10);
#EMA10.AssignValueColor(Color.CYAN);
#EMA10.HideBubble();
#EMA10.HideTitle();
#EMA10.SetLineWeight(1);
#EMA10.SetPaintingStrategy(PaintingStrategy.LINE);

def EMA30 = MovAvgExponential(cl, ema_30);
#EMA30.AssignValueColor(Color.MAGENTA);
#EMA30.HideBubble();
#EMA30.HideTitle();
#EMA30.SetLineWeight(1);
#EMA30.SetPaintingStrategy(PaintingStrategy.LINE);

#def EMA300 = MovAvgExponential(cl, ema_300);
#EMA300.AssignValueColor(Color.GREEN);
#EMA300.HideBubble();
#EMA300.HideTitle();
#EMA300.SetLineWeight(2);
#EMA300.SetStyle(Curve.LONG_DASH);
#EMA300.SetPaintingStrategy(PaintingStrategy.LINE);

plot signal =
if cl <= EMA10 and cl >= EMA30 and EMA10 >= EMA30 and count_up > 0 and average(vo,5) < average(vo,50) then 1 else
if cl >= EMA10 and cl <= EMA30 and EMA10 <= EMA30 and count_dn > 0 and average(vo,5) < average(vo,50) then 1 else 0;
 
Last edited by a moderator:

Join useThinkScript to post your question to a community of 21,000+ developers and traders.

Hi
This is an interesting strategy. But, Im confused how to use this. As in, how do I set up the scanner - do I have to copy the script into the scanner part or do I have to copy this as an indicator/strategy code and set up the scanner separately ?
Thanks is advance
 
Copy the script, go to studies in TOS, click Create, delete everything then paste script above into study, change the name at the top and hit okay. Go to Scan, hit Study Filter, go all the way down to custom, hit delete, add condition, scroll to study, find whatever you named the study, click it, select "is true" within "however many bars". Hit okay and scan.
Don't forget aggregation periods for your scans.
 
@MBF thank you for giving that very succinct explanation. It often takes me three paragraphs to say what you did in four sentences or so. 🙏
Much wine for you, my friend.
 
  • Like
Reactions: MBF
I got the scan set up and it works great showing me the stocks that have gapped up on their past earnings but what do I need to add for it to show me stocks that have had earning gap ups within the past day or two? Thanks in advance!!
 
@jacqshen Have you tried to use the "within X bars" feature? That will allows you to set a lookback period.
 
@jacqshen There may not be many stocks that have earnings yet. Or, gaps may not have happened yet.
Save it as a Dynamic Scan and it will update every 3 minutes so that when earnings come rolling in over the next few weeks you can see the gappers when they occur.
Go here: Marketwach > Calendar > Uncheck all > Check Earnings > now you can see that there were only 8 or so companies that reported today.
GJ7ncj7.png
 

Attachments

  • GJ7ncj7.png
    GJ7ncj7.png
    201.7 KB · Views: 131
@jacqshen Put this in as a Watchlist Column. Then you'll know the scheduled date. I use this one. Origin unknown, no citation.
Code:
#Days_til_Earns Markos uTS
input length = 60;
def xx= -geteventOffset(events.EARNINGS);
def yy = sum(hasEarnings(type = earningTime.AFTER_MARKET),length)[-length +1] >0;
plot x=xx+yy*.5;
x.assignvaluecolor( if yy!=0 then color.LIGHT_RED else color.DARK_GRAY);
Vgop5Iy.png


@BenTen please feel free to move or copy this to another thread.
 

Attachments

  • Vgop5Iy.png
    Vgop5Iy.png
    30.3 KB · Views: 138
Last edited:
Hello all, thanks for sharing this valuable info. I tried getting this Scan set up using the custom study code provided here. I put it in the "All of the following tab". Then hit scan. Does not seem to work, the scan gives me a huge number of stocks. So something is not working. Can someone smart help me point out what's not working? I'd like to post a pic, but the system is not allowing me to.
@SamTrader77, What other filters are you using? Using minimal filters, I show 596 results on a Daily Aggregation.
nxEWR33.png


With more aggressive filtering:
JpE8I7U.png

I get 26 results. Depends on what you are looking for. We are in earnings season; you will need to be exact in your definitions.
 
Thanks VERY much for this info @MerryDay . I will use more filters to narrow down results. I also noted that that there are two ways to add such a study/filter. It can be done as a stored study OR as a custom filter by entering the code into the editor, as I set the filtering. I will also use 6 bars, not 3 like I did before.

Wondering, How has this code/strategy worked out for folks? Just curious as I am new to this. Thanks again for the help. It's MUCH appreciated.
 
What would an ideal bar setting be for this? Is there a reference in stewies' writings? Any suggestions? Haven't seen any action so I'm curious what to put in for this.
 
Copy the script, go to studies in TOS, click Create, delete everything then paste script above into study, change the name at the top and hit okay. Go to Scan, hit Study Filter, go all the way down to custom, hit delete, add condition, scroll to study, find whatever you named the study, click it, select "is true" within "however many bars". Hit okay and scan.
Don't forget aggregation periods for your scans.
thank you , let me try
 

Similar threads

Not the exact question you're looking for?

Start a new thread and receive assistance from our community.

87k+ Posts
513 Online
Create Post

Similar threads

Similar threads

The Market Trading Game Changer

Join 2,500+ subscribers inside the useThinkScript VIP Membership Club
  • Exclusive indicators
  • Proven strategies & setups
  • Private Discord community
  • ‘Buy The Dip’ signal alerts
  • Exclusive members-only content
  • Add-ons and resources
  • 1 full year of unlimited support

Frequently Asked Questions

What is useThinkScript?

useThinkScript is the #1 community of stock market investors using indicators and other tools to power their trading strategies. Traders of all skill levels use our forums to learn about scripting and indicators, help each other, and discover new ways to gain an edge in the markets.

How do I get started?

We get it. Our forum can be intimidating, if not overwhelming. With thousands of topics, tens of thousands of posts, our community has created an incredibly deep knowledge base for stock traders. No one can ever exhaust every resource provided on our site.

If you are new, or just looking for guidance, here are some helpful links to get you started.

What are the benefits of VIP Membership?
VIP members get exclusive access to these proven and tested premium indicators: Buy the Dip, Advanced Market Moves 2.0, Take Profit, and Volatility Trading Range. In addition, VIP members get access to over 50 VIP-only custom indicators, add-ons, and strategies, private VIP-only forums, private Discord channel to discuss trades and strategies in real-time, customer support, trade alerts, and much more. Learn all about VIP membership here.
How can I access the premium indicators?
To access the premium indicators, which are plug and play ready, sign up for VIP membership here.
Back
Top