
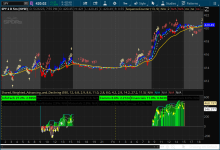
I would like to have the indices shown on the upper part of the chart by the candles.
I don't know if you could simply copy and paste the code from where it says
add label. Or if I need to add any special code before or after the code I copied so that it will show up in the upper part.
Weighted Advancing and Declining Issues
http://tos.mx/pL7BP15
ThinkScript_study_20220507
Weighted_Advancing_and_Declining
SCRIPT:
Code:
# # Sources:
# best with 5 mins timeframe.
# concept from shadowtrader.net
# coded by TWOO
# [URL]https://www.spglobal.com/spdji/en/indices/equity/sp-500/#data[/URL]
# sector-breakdown

declare lower;
input open_time = 930;

DEF displace = 0;
input length = 12;
input xlpwt = 6.8; #ConsumerStaples
input xluwt = 2.9; #Utilities
input xlcwt = 8.6; #Communications
input xlfwt = 11.0; #Financials
input xlbwt = 2.8; #Materials
input xliwt = 8.0; #Industrials
input xlewt = 4.2; #Energy
input xlrewt = 2.9; #RealEstate
input xlvwt = 14.2; #HealthCare
input xlkwt = 27.2; #InformationTechnology
input xlywt = 11.5; #ConsumerDiscretionary

def SectorCount = 11;
def Scale = 5000;

#SP500 ETF sectors percent change
script PC {
    input Symbol = "SPX";
    def isFirstBar = GetTime() == RegularTradingStart(GetYYYYMMDD()) + 1;
    def O = if isFirstBar then close(Symbol) else O[1];
    def C = close(Symbol);
    plot PctChg = (C - O) / O;
}
def xlkPctChg = PC("XLK");
def xlyPctChg = PC("XLY");
def xlvPctChg = PC("XLV");
def xlfPctChg = PC("XLF");
def xlcPctChg = PC("XLC");
def xliPctChg = PC("XLI");
def xlpPctChg = PC("XLP");
def xlrePctChg = PC("XLRE");
def xlePctChg = PC("XLE");
def xlbPctChg = PC("XLB");
def xluPctChg = PC("XLU");


def xlkSizing = xlkPctChg * xlkwt;
def xlvSizing = xlvPctChg * xlvwt;
def xlySizing = xlyPctChg * xlywt;
def xlfSizing = xlfPctChg * xlfwt;
def xlcSizing = xlcPctChg * xlcwt;
def xliSizing = xliPctChg * xliwt;
def xlpSizing = xlpPctChg * xlpwt;
def xleSizing = xlePctChg * xlewt;
def xlreSizing = xlrePctChg * xlrewt;
def xlbSizing = xlbPctChg * xlbwt;
def xluSizing = xluPctChg * xluwt;
def combinedSizing = Scale * (
xlkSizing +
xlvSizing +
xlySizing +
xlfSizing +
xlcSizing +
xliSizing +
xlpSizing +
xleSizing +
xlreSizing +
xlbSizing +
xluSizing
) / SectorCount;

# Weighted_AD
DEF Weighted_AD = if !IsNaN(combinedSizing) then combinedSizing else Double.NaN;
#Weighted_AD.DefineColor("Lower", Color.YELLOW);
#Weighted_AD.DefineColor("Higher", Color.MAGENTA);
#Weighted_AD.AssignValueColor(if Weighted_AD < Weighted_AD[1] then Weighted_AD.Color("Lower") else  Weighted_AD.Color("Higher"));
#Weighted_AD.SetPaintingStrategy(PaintingStrategy.HISTOGRAM);

plot LowerBand = Lowest(Weighted_AD[-displace + 1], length);
LowerBand.SetDefaultColor(GetColor(8));

plot UpperBand = Highest(Weighted_AD[-displace + 1], length);
UpperBand.SetDefaultColor(GetColor(1));

PLOT MID = (UPPERBand + LOWErBand)/2;


plot Diff_Weighted_AD = Weighted_AD;

Diff_Weighted_AD.SetDefaultColor(GetColor(5));
Diff_Weighted_AD.SetPaintingStrategy(PaintingStrategy.sQUARED_HISTOGRAM);
Diff_Weighted_AD.SetLineWeight(3);
Diff_Weighted_AD.DefineColor("Positive and Up", Color.GREEN);
Diff_Weighted_AD.DefineColor("Positive and Down", Color.DARK_GREEN);
Diff_Weighted_AD.DefineColor("Negative and Down", Color.RED);
Diff_Weighted_AD.DefineColor("Negative and Up", Color.pink);
Diff_Weighted_AD.AssignValueColor(if Diff_Weighted_AD >= 0 then if Diff_Weighted_AD > Diff_Weighted_AD[1] then Diff_Weighted_AD.color("Positive and Up") else Diff_Weighted_AD.color("Positive and Down") else if Diff_Weighted_AD < Diff_Weighted_AD[1] then Diff_Weighted_AD.color("Negative and Down") else Diff_Weighted_AD.color("Negative and Up"));

#Zeroline
plot zero = 0;
zero.SetDefaultColor(Color.GRAY);
zero.HideBubble();
zero.HideTitle();

# SPX Non_Weighted_AD
def spxcombinedSizing = Scale *
(xlkPctChg +
xlvPctChg +
xlyPctChg +
xlfPctChg +
xlcPctChg +
xliPctChg +
xlpPctChg +
xlePctChg +
xlrePctChg +
xlbPctChg +
xluPctChg);
plot Non_Weighted_AD =  spxcombinedSizing ;
Non_Weighted_AD.SetDefaultColor(Color.WHITE);
Non_Weighted_AD.SetPaintingStrategy(PaintingStrategy.LINE);
DefineGlobalColor("Bullish", Color.cyan);
DefineGlobalColor("Bearish", Color.pink);
AddCloud(Non_Weighted_AD, zero , globalColor("Bullish"), globalColor("Bearish"));
# NDX Non_Weighted_AD
def NDXPctChg = PC("NDX") * 35000;
plot Non_Weighted_NDX = NDXPctChg   ;
Non_Weighted_NDX.SetDefaultColor(Color.CYAN);
Non_Weighted_NDX.SetLineWeight(1);
Non_Weighted_NDX.Hide();
Non_Weighted_NDX.HideBubble();
Non_Weighted_NDX.HideTitle();

def na = double.NaN ;
def isbulldiv = if (weighted_AD - weighted_AD[1] )>0 and (LOW[1] - LOW)>0 then 1 else 0;
def isbeardiv = if (weighted_AD[1] - weighted_AD )>0  and (HIGH - HIGH[1])>0  then 1 else 0;

DEF PositveDivergence = if

         isbulldiv > 0 then
        non_Weighted_AD else na;

plot PD = if PositveDivergence IS TRUE then non_Weighted_AD else Double.NaN;
PD.SetPaintingStrategy(PaintingStrategy.ARROW_UP);
PD.SetDefaultColor(Color.WHITE);
PD.HideBubble();
PD.HideTitle();

DEF NegativeDivergence = if

         isbeardiv > 0 then
        non_Weighted_AD else na;

plot ND = if NEGativeDivergence  IS TRUE then non_Weighted_AD else Double.NaN;
ND.SetPaintingStrategy(PaintingStrategy.ARROW_DOWN);
ND.SetDefaultColor(Color.YELLOW);
ND.HideBubble();
ND.HideTitle();


AddVerticalLine(( GetDay() <> GetDay()[1]), "", Color.YeLLOW, Curve.SHORT_DASH);

#SP500 ETF sectors BUBBLE
Script pct {
input Symbol = "SPX";
def aggregationPeriod = AggregationPeriod.DAY;
def price = open(Symbol, period = aggregationPeriod);
def diff = close (Symbol) - open(Symbol, period = aggregationPeriod);
 plot d_pct = 100 * diff / price;
}

def XLK_d_pct = pct(“XLK”)  ;
 def XLV_d_pct = pct(“XLV”)  ;
def XLY_d_pct = pct(“XLY”)  ;
def XLC_d_pct = pct(“XLC”)  ;
 def XLF_d_pct = pct(“XLF”)  ;
 def XLI_d_pct = pct(“XLI”)  ;
 def XLP_d_pct = pct(“XLP”)  ;
 def XLRE_d_pct = pct(“XLRE”)  ;
 def XLB_d_pct = pct(“XLB”)  ;
 def XLU_d_pct = pct(“XLU”)  ;
def XLE_d_pct = pct(“XLE”)  ;

AddLabel(yes, "InfoTech 27.2%: " + XLK_d_pct,  (if xlk_d_pct > 0 then Color.GREEN else if xlk_d_pct < 0 then color.RED else Color.gray));

AddLabel(yes, "Healthcare 14.2%: " + XLV_d_pct, (if xlv_d_pct > 0 then Color.GREEN else if xlv_d_pct < 0 then color.RED else Color.gray));

AddLabel(yes, "ConsDisc 11.5: " + XLY_d_pct, (if xly_d_pct > 0 then Color.GREEN else if xly_d_pct < 0 then color.RED else Color.gray));

AddLabel(yes, "Comms 8.6%: " + XLC_d_pct, (if xlc_d_pct > 0 then Color.GREEN else if xlc_d_pct < 0 then color.RED else Color.gray));

AddLabel(yes, "Financials 11.0%: " + XLF_d_pct, (if xlf_d_pct > 0 then Color.GREEN else if xlf_d_pct < 0 then color.RED else Color.gray));

AddLabel(yes, "Industrials 8.0%: " + XLI_d_pct,(if xli_d_pct > 0 then Color.GREEN else if xli_d_pct < 0 then color.RED else Color.gray));

AddLabel(yes, "ConsStaples 6.8%: " + XLP_d_pct, (if xlp_d_pct > 0 then Color.GREEN else if xlp_d_pct < 0 then color.RED else Color.gray));

AddLabel(yes, "RealEstate 2.9%: " + XLRE_d_pct,(if xlre_d_pct > 0 then Color.GREEN else if xlre_d_pct < 0 then color.RED else Color.gray));

AddLabel(yes, "Materials 2.8%: " + XLB_d_pct, (if xlb_d_pct > 0 then Color.GREEN else if xlb_d_pct < 0 then color.RED else Color.gray));

AddLabel(yes, "Utilities 2.9%: " + XLU_d_pct, (if xlu_d_pct > 0 then Color.GREEN else if xlu_d_pct < 0 then color.RED else Color.gray));

AddLabel(yes, "Energy 4.2%: " + XLE_d_pct,(if xle_d_pct > 0 then Color.GREEN else if xle_d_pct < 0 then color.RED else Color.gray));
Attachments
Last edited by a moderator: