Would it be possible to take the code below that I have on the options chain and build a lower study that would show the change in gamma for the highlighted Strikes for 0DTE? Even if I had to change the date each day in the code to get it to pull the data? I would want this for SPX and SPY so I could see change in gamma on the chart without having to open up the options chain. I view this every day to get an idea of the gamma wall that may be support or resistance. What I have noticed is that on the SPX if gamma is call heavy then it most likely goes up and those strikes are ITM at end of day. And on SPY just the opposite. Seems to be more of a contrarian indicator on SPY and a direction on SPX. But only 0DTE matters.
CODE
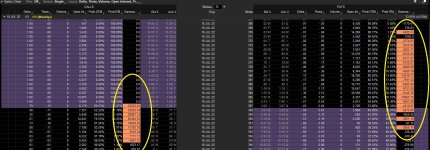
# Gamma Exposure at each strike is calculated by the formula option gamma * open interest * 100 (calls, x-100 for puts)
plot data = if IsPut() then gamma() * -100 * open_interest() else gamma() * 100 * open_interest();
assignbackgroundcolor(if AbsValue(data) > 2000 then createcolor(250,150,100) else color.black);
data.assignvaluecolor(if AbsValue(data) > 2000 then color.black else color.current);
15176[/ATTACH]']

CODE
# Gamma Exposure at each strike is calculated by the formula option gamma * open interest * 100 (calls, x-100 for puts)
plot data = if IsPut() then gamma() * -100 * open_interest() else gamma() * 100 * open_interest();
assignbackgroundcolor(if AbsValue(data) > 2000 then createcolor(250,150,100) else color.black);
data.assignvaluecolor(if AbsValue(data) > 2000 then color.black else color.current);
15176[/ATTACH]']