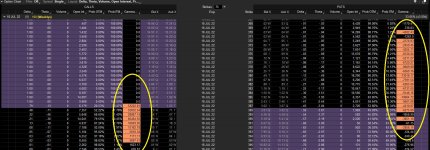
Options Gamma Study For ThinkOrSwim

Would it be possible to take the code below that I have on the options chain and build a lower study that would show the change in gamma for the highlighted Strikes for 0DTE? Even if I had to change the date each day in the code to get it to pull the data? I would want this for SPX and SPY so I could see change in gamma on the chart without having to open up the options chain. I view this every day to get an idea of the gamma wall that may be support or resistance. What I have noticed is that on the SPX if gamma is call heavy then it most likely goes up and those strikes are ITM at end of day. And on SPY just the opposite. Seems to be more of a contrarian indicator on SPY and a direction on SPX. But only 0DTE matters.

CODE
# Gamma Exposure at each strike is calculated by the formula option gamma * open interest * 100 (calls, x-100 for puts)

plot data = if IsPut() then gamma() * -100 * open_interest() else gamma() * 100 * open_interest();
assignbackgroundcolor(if AbsValue(data) > 2000 then createcolor(250,150,100) else color.black);
data.assignvaluecolor(if AbsValue(data) > 2000 then color.black else color.current);
15176[/ATTACH]']
Ua5aYVo.jpg
 

Attachments

  • Ua5aYVo.jpg
    Ua5aYVo.jpg
    448.8 KB · Views: 1,604
I have done this process of sharing links 100's of times and never had any issues. The newest link you sent does not work for me. Thanks for trying again. I'm done. Take care P.S. I tried it on another computer to see if it would help but it failed there too
I don't know why it's not working since it's the same script that I copied here from thread #64.
 
@halcyonguy Can this code be made as a lower study chart and label?
plot data = if IsPut() then gamma() * -100 * open_interest() else gamma() * 100 * open_interest();

def rangeHigh = Highestall (absvalue(data)) ;


assignbackgroundcolor (if absvalue(data) > 1000000 then color.white else if AbsValue(data) > 500000 then color.gray else if absvalue(data) > 200000 then color.green else if absvalue(data) > 100000 then color.yellow else if AbsValue(data) > 50000 then color.light_orange else if AbsValue(data) > 20000 then color.cyan else if AbsValue(data) > 9999 then createcolor(250,150,100) else color.black);


data.assignvaluecolor(if absvalue (data) > 200000 then color.blue else if absvalue (data) > 100000 then color.light_red else if AbsValue(data) > 9999 then color.black else color.current);


1KOmlQa.jpg
 
@samer800 Can you covert the code to a lower study on a chart?

plot data = if IsPut() then gamma() * -100 * open_interest() else gamma() * 100 * open_interest();

def rangeHigh = Highestall (absvalue(data)) ;


assignbackgroundcolor (if absvalue(data) > 1000000 then color.white else if AbsValue(data) > 500000 then color.gray else if absvalue(data) > 200000 then color.green else if absvalue(data) > 100000 then color.yellow else if AbsValue(data) > 50000 then color.light_orange else if AbsValue(data) > 20000 then color.cyan else if AbsValue(data) > 9999 then createcolor(250,150,100) else color.black);


data.assignvaluecolor(if absvalue (data) > 200000 then color.blue else if absvalue (data) > 100000 then color.light_red else if AbsValue(data) > 9999 then color.black else color.current);
 
thank you for pointing out the uselessness of the highestall line in the code. also, I added gray background for spx options on any reading 1000+ .


plot data = if IsPut() then gamma() * -100 * open_interest() else gamma() * 100 * open_interest();


assignbackgroundcolor (if absvalue(data) > 1000000 then color.white else if AbsValue(data) > 500000 then color.gray else if absvalue(data) > 200000 then color.green else if absvalue(data) > 100000 then color.yellow else if AbsValue(data) > 50000 then color.light_orange else if AbsValue(data) > 20000 then color.cyan else if AbsValue(data) > 9999 then createcolor(250,150,100) else if AbsValue(data) > 999 then color.light_gray else color.black);


data.assignvaluecolor(if absvalue (data) > 200000 then color.blue else if absvalue (data) > 100000 then color.light_red else if AbsValue(data) > 999 then color.black else color.current);
 
Hi I was able to add this to my Thinkorswim. But I want to understand more about what the highlighted numbers mean. For example of SPX, there are highlighted values on each side of the options. The one is negative and other positive, which one implies a potential market move? Can you provide some info on it? Your help is much appreciated, thanks!
 
GEX works amazingly on the trade section of TOS but is there any way to plot it on the graph? I have a code that highlights levels on the chart but I'm having issues adding the gex on it
I have been exploring GEX and observing it in the SPY 0DTE options chain. It's fascinating how market gets repelled and attracted at net positive and net negative gex. Do you still trade using gex? Mind sharing the type of trades you jam on and how you go about entering and exit your trades?
 
I have been exploring GEX and observing it in the SPY 0DTE options chain. It's fascinating how market gets repelled and attracted at net positive and net negative gex. Do you still trade using gex? Mind sharing the type of trades you jam on and how you go about entering and exit your trades?
What do you mean "gets repelled and attracted at net positive and net negative gex"?
 
Hi I was able to add this to my Thinkorswim. But I want to understand more about what the highlighted numbers mean. For example of SPX, there are highlighted values on each side of the options. The one is negative and other positive, which one implies a potential market move? Can you provide some info on it? Your help is much appreciated, thanks!
Curious if anyone has any further insight on this question.
 
can't get the diff color tabs can someone help with this?

this is what I am putting in and nothing

plot data = if IsPut() then gamma() * -100 * open_interest() else gamma() * 100 * open_interest();

def rangeHigh = Highestall (absvalue(data)) ;


assignbackgroundcolor (if absvalue(data) > 1000000 then color.white else if AbsValue(data) > 500000 then color.gray else if absvalue(data) > 200000 then color.green else if absvalue(data) > 100000 then color.yellow else if AbsValue(data) > 50000 then color.light_orange else if AbsValue(data) > 20000 then color.cyan else if AbsValue(data) > 9999 then createcolor(250,150,100) else color.black);


data.assignvaluecolor(if absvalue (data) > 200000 then color.blue else if absvalue (data) > 100000 then color.light_red else if AbsValue(data) > 9999 then color.black else color.current);

1709829242565.png

see I just have the regular one. thanks
 
Does anyone know why as of this week this study is no longer working on 0DTE? Are they blocking the data deliberately?

@MerryDay Do you know why this isn't working on 0DTE now?
I'm experiencing a similar problem. So far, I've narrowed the problem down to 1) it's limited to 0DTE option tables, other time frames still work. 2) '0' is always returned for function calls to any option greek -- gamma, delta, theta, etc. However the preset columns for these greeks continue to work, just not the thinkScript calls for these greeks.

I spoke to a thinkorswim support person at Schwab last week. He was not aware of the problem. He said he was going to check with a thinkScript expert and call me back. He never called back.

Perhaps it would help if multiple users reported the problem to Schwab. Otherwise the issue will be sent to the island of unresolved TOS issues. After 20 years, I think they need to move to a larger island.
 
TRYING TO FOLLOW HOW TO USE THIS INFO THIS IS WHAT i KNOW:
More positive gamma exposure at certain option strike price points can have a significant impact on how market makers manage their positions, which in turn can influence the price movement of the stock. However, it doesn't directly signify the direction of the market or stock in the traditional sense (i.e., it's not a bullish or bearish signal by itself). Instead, it reflects how market participants may respond to price changes. Let me break this down:

Understanding Gamma Exposure:​

  • Gamma measures how much the delta(sensitivity of an option’s price to changes in the underlying asset) changes with respect to the stock price.
    • Positive gamma: When options are in a high positive gamma environment, delta increases more significantly as the stock price rises and decreases more when the stock price falls.
    • Negative gamma: On the other hand, in a negative gamma environment, delta decreases as the stock rises and increases as the stock falls, amplifying price moves.

Role of Market Makers:​

Market makers and institutional traders hedge their exposure to options, and gamma exposure plays a crucial role in how they adjust their positions:

  • In positive gamma exposure environments (especially around key strike prices), market makers tend to hedge by buying the underlying asset when it falls and selling when it rises. This stabilizes the market and reduces volatility because their hedging actions work against the market's direction.
  • In negative gamma exposure environments, market makers may need to adjust their positions by buying when the stock rises and selling when it falls, which can amplify price movements and increase volatility.

Key Points to Consider:​

  1. Positive Gamma Exposure:
    • When there is more positive gamma exposure (i.e., large open interest in call options with high gamma), market makers may hedge in a way that dampens volatility, as they will trade against the market's movement.
    • Implication: In a strong positive gamma environment, large price moves are less likely because market makers are constantly adjusting their hedges in the opposite direction of the stock’s price movement. This could indicate a more stable or range-bound market.
  2. Negative Gamma Exposure:
    • If the environment has more negative gamma exposure (often from put options), market makers may be forced to hedge in a way that amplifies market movements. When the stock price declines, they sell more of the underlying, which can push the price lower, and when it rises, they buy, which can push it higher.
    • Implication: In a strong negative gamma environment, expect more volatility and the possibility of large swings in either direction.

Does More Positive Gamma Exposure Indicate Market Direction?​

Not directly. More positive gamma exposure does not suggest the market will necessarily go up or down. Instead, it indicates that:

  • The market may experience lower volatility, as market makers are likely to stabilize price movements.
  • Stock price movements could be more range-bound and controlled, as hedging in positive gamma environments often involves market makers selling when the stock rises and buying when it falls.

Conclusion:​

  • More positive gamma exposure suggests a less volatile market environment, but it does not directly indicate that the market or stock will move in a specific direction (up or down).
  • If there is significant positive gamma around certain strike prices, it may indicate that the stock could gravitate towards those strikes (due to the hedging activities of market makers) but within a tighter range.
  • Conversely, in negative gamma exposure environments, you may see greater volatility and larger price moves in either direction, but again, it's not a clear indicator of direction.
In summary, gamma exposure tells more about market behavior (volatility and hedging impact) rather than market direction itself.

So it seems that gamma exposure is truly a one-sided deal more in favor of negative gamma environments that force the market makers to move the markets with increased volatility. Positive gamma makes it trade in a range - so how are you guys using this data on the trade page?
 
gamma() stopped working on0DTE option chains three Monday's ago.

Schwab tech support (which is clearly lower tier than TOS old tech support) cannot help.
I'm experiencing a similar problem. So far, I've narrowed the problem down to 1) it's limited to 0DTE option tables, other time frames still work. 2) '0' is always returned for function calls to any option greek -- gamma, delta, theta, etc. However the preset columns for these greeks continue to work, just not the thinkScript calls for these greeks. Is Schwab intentionally suppressing scripts in 0DTE tables to improve performance? I don't know.

I spoke to a thinkorswim support person at Schwab last week. He was not aware of the problem. He said he was going to check with a thinkScript expert and call me back. He never called back.
 

Join useThinkScript to post your question to a community of 21,000+ developers and traders.

Similar threads

Not the exact question you're looking for?

Start a new thread and receive assistance from our community.

87k+ Posts
305 Online
Create Post

Similar threads

Similar threads

The Market Trading Game Changer

Join 2,500+ subscribers inside the useThinkScript VIP Membership Club
  • Exclusive indicators
  • Proven strategies & setups
  • Private Discord community
  • ‘Buy The Dip’ signal alerts
  • Exclusive members-only content
  • Add-ons and resources
  • 1 full year of unlimited support

Frequently Asked Questions

What is useThinkScript?

useThinkScript is the #1 community of stock market investors using indicators and other tools to power their trading strategies. Traders of all skill levels use our forums to learn about scripting and indicators, help each other, and discover new ways to gain an edge in the markets.

How do I get started?

We get it. Our forum can be intimidating, if not overwhelming. With thousands of topics, tens of thousands of posts, our community has created an incredibly deep knowledge base for stock traders. No one can ever exhaust every resource provided on our site.

If you are new, or just looking for guidance, here are some helpful links to get you started.

What are the benefits of VIP Membership?
VIP members get exclusive access to these proven and tested premium indicators: Buy the Dip, Advanced Market Moves 2.0, Take Profit, and Volatility Trading Range. In addition, VIP members get access to over 50 VIP-only custom indicators, add-ons, and strategies, private VIP-only forums, private Discord channel to discuss trades and strategies in real-time, customer support, trade alerts, and much more. Learn all about VIP membership here.
How can I access the premium indicators?
To access the premium indicators, which are plug and play ready, sign up for VIP membership here.
Back
Top