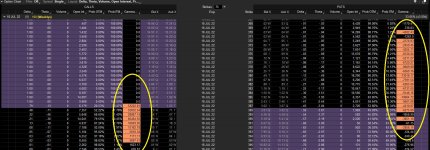
Options Gamma Study For ThinkOrSwim

Would it be possible to take the code below that I have on the options chain and build a lower study that would show the change in gamma for the highlighted Strikes for 0DTE? Even if I had to change the date each day in the code to get it to pull the data? I would want this for SPX and SPY so I could see change in gamma on the chart without having to open up the options chain. I view this every day to get an idea of the gamma wall that may be support or resistance. What I have noticed is that on the SPX if gamma is call heavy then it most likely goes up and those strikes are ITM at end of day. And on SPY just the opposite. Seems to be more of a contrarian indicator on SPY and a direction on SPX. But only 0DTE matters.

CODE
# Gamma Exposure at each strike is calculated by the formula option gamma * open interest * 100 (calls, x-100 for puts)

plot data = if IsPut() then gamma() * -100 * open_interest() else gamma() * 100 * open_interest();
assignbackgroundcolor(if AbsValue(data) > 2000 then createcolor(250,150,100) else color.black);
data.assignvaluecolor(if AbsValue(data) > 2000 then color.black else color.current);
15176[/ATTACH]']
Ua5aYVo.jpg
 

Attachments

  • Ua5aYVo.jpg
    Ua5aYVo.jpg
    448.8 KB · Views: 1,457
No, but I just realized it can be used in a watchlist as well as the options chain. Please repost your script so I can see if it works for me thanks

How do you do that?

plot data = if IsPut() then gamma() * -100 * open_interest() else gamma() * 100 * open_interest();

def rangeHigh = Highestall (absvalue(data)) ;


assignbackgroundcolor (if absvalue(data) > 1000000 then color.white else if AbsValue(data) > 500000 then color.gray else if absvalue(data) > 200000 then color.green else if absvalue(data) > 100000 then color.yellow else if AbsValue(data) > 50000 then color.light_orange else if AbsValue(data) > 20000 then color.cyan else if AbsValue(data) > 9999 then createcolor(250,150,100) else color.black);


data.assignvaluecolor(if absvalue (data) > 200000 then color.blue else if absvalue (data) > 100000 then color.light_red else if AbsValue(data) > 9999 then color.black else color.current);
Do mean how do I use it in a watchlist Column? Here is a watchlist link. Make sure you name in Gamma (something) so you can find it) http://tos.mx/LrfSxhc
 
How do you do that?

plot data = if IsPut() then gamma() * -100 * open_interest() else gamma() * 100 * open_interest();

def rangeHigh = Highestall (absvalue(data)) ;


assignbackgroundcolor (if absvalue(data) > 1000000 then color.white else if AbsValue(data) > 500000 then color.gray else if absvalue(data) > 200000 then color.green else if absvalue(data) > 100000 then color.yellow else if AbsValue(data) > 50000 then color.light_orange else if AbsValue(data) > 20000 then color.cyan else if AbsValue(data) > 9999 then createcolor(250,150,100) else color.black);


data.assignvaluecolor(if absvalue (data) > 200000 then color.blue else if absvalue (data) > 100000 then color.light_red else if AbsValue(data) > 9999 then color.black else color.current);
Can not make this script work
 
The SPX Gamma (yellow background) "Targets" hit today on the PUT Options

I was watching the options chain this morning. I noticed that SPY moves in the direction of contracts with a higher GEX. So I thought it could be good to use it to scalp. Especially when the GEX is over 100k on one side.
 
It's not showing. It says NaN

DvBrBke.jpg
Yeah, it doesnot work for me
I'm trying to copy the script and share it but I can't find the options to share the link. I'm going to copy it to studies and save it so that I can send it as a shared link. https://tos.mx/lXKzeP0

HoEo2q6.jpg
Your sent the link as a Strategy Here is how to create the link in the options chain tab: Open the options chain under the trade tab.

qk1PQxw.png


8CHsJ2r.png


HdL0nBy.png


4WbW9sk.png


TXTqIP5.png
 
The link you sent does not allow it to be used in the Options Chain. No need to spend any more time on this. I can live with what I already have. Take care and good trading!
 
The link you sent does not allow it to be used in the Options Chain. No need to spend any more time on this. I can live with what I already have. Take care and good trading!
That's weird. I followed the procedure you showed me on how to share the link. I'm trying it one more time. https://tos.mx/VWf2UpO Also, the link you gave me is showing Nan on my options chain. Maybe @Chemmy can help.

sekcadg.jpg
 
Last edited:
That's weird. I followed the procedure you showed me on how to share the link. I'm trying it one more time. https://tos.mx/VWf2UpO Also, the link you gave me is showing Nan on my options chain. Maybe @Chemmy can help.

sekcadg.jpg
I have done this process of sharing links 100's of times and never had any issues. The newest link you sent does not work for me. Thanks for trying again. I'm done. Take care P.S. I tried it on another computer to see if it would help but it failed there too
 

Join useThinkScript to post your question to a community of 21,000+ developers and traders.

Similar threads

Not the exact question you're looking for?

Start a new thread and receive assistance from our community.

87k+ Posts
337 Online
Create Post

Similar threads

Similar threads

The Market Trading Game Changer

Join 2,500+ subscribers inside the useThinkScript VIP Membership Club
  • Exclusive indicators
  • Proven strategies & setups
  • Private Discord community
  • ‘Buy The Dip’ signal alerts
  • Exclusive members-only content
  • Add-ons and resources
  • 1 full year of unlimited support

Frequently Asked Questions

What is useThinkScript?

useThinkScript is the #1 community of stock market investors using indicators and other tools to power their trading strategies. Traders of all skill levels use our forums to learn about scripting and indicators, help each other, and discover new ways to gain an edge in the markets.

How do I get started?

We get it. Our forum can be intimidating, if not overwhelming. With thousands of topics, tens of thousands of posts, our community has created an incredibly deep knowledge base for stock traders. No one can ever exhaust every resource provided on our site.

If you are new, or just looking for guidance, here are some helpful links to get you started.

What are the benefits of VIP Membership?
VIP members get exclusive access to these proven and tested premium indicators: Buy the Dip, Advanced Market Moves 2.0, Take Profit, and Volatility Trading Range. In addition, VIP members get access to over 50 VIP-only custom indicators, add-ons, and strategies, private VIP-only forums, private Discord channel to discuss trades and strategies in real-time, customer support, trade alerts, and much more. Learn all about VIP membership here.
How can I access the premium indicators?
To access the premium indicators, which are plug and play ready, sign up for VIP membership here.
Back
Top