Tiredoflosing
Member
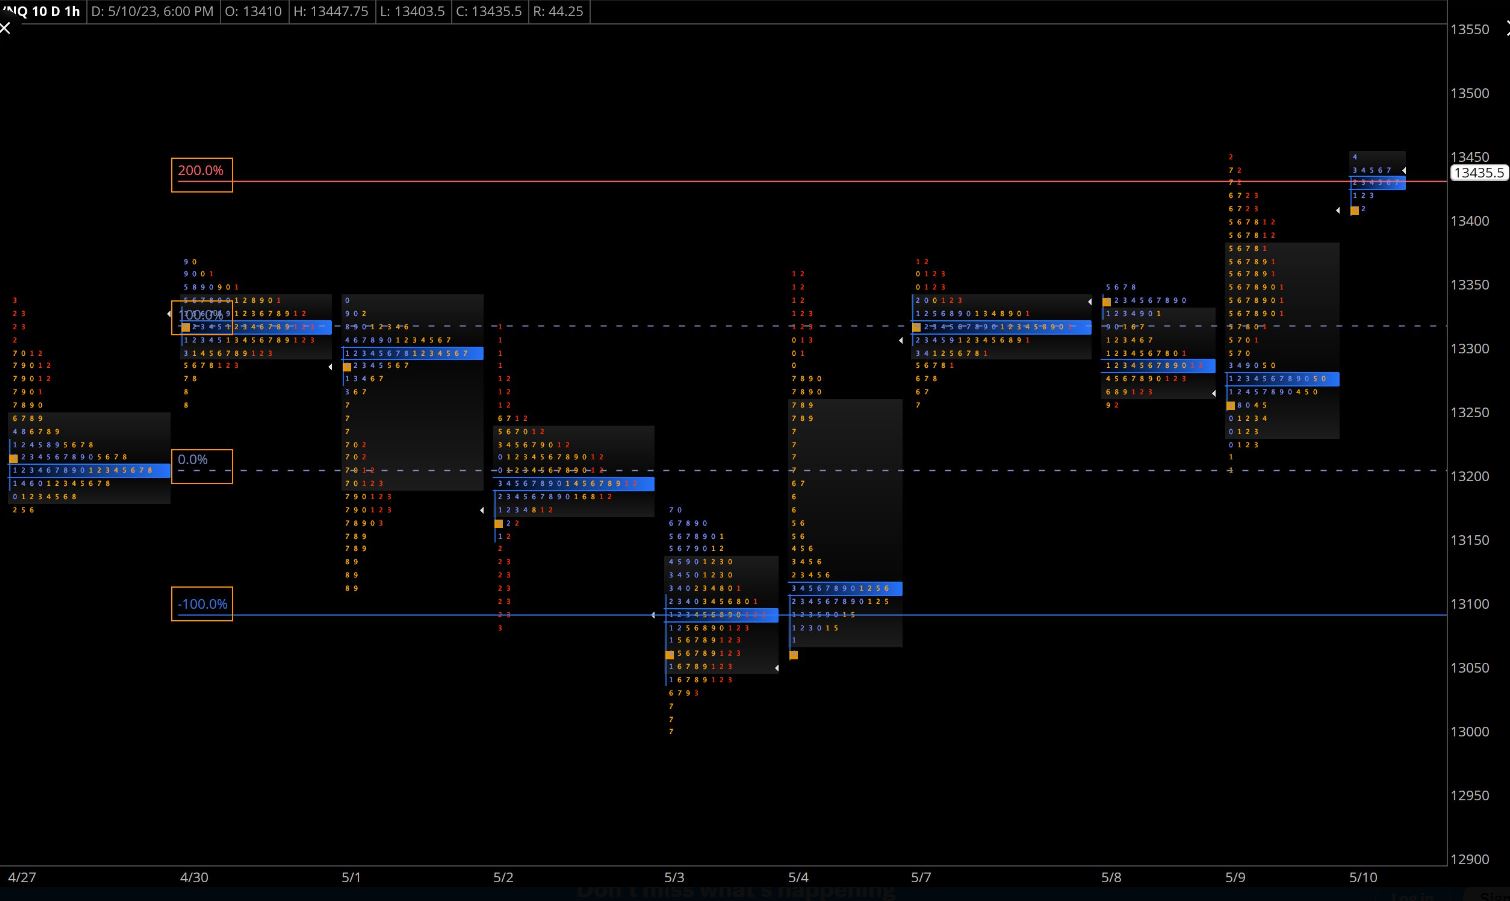
NextSignal's Market Volume Profile For ThinkOrSwim
Per @itsjt562 request

Per @itsjt562 request
This is a great script and a unique way of looking at volume profile. Highly recommend more people check it out. The POCExt lines are simply extensions of the POC and TPO_POC lines for the 'next' set of candles. I actually hide the POC and TPO_POC lines and ONLY use the EXT lines...but that's just me.
Ruby:
plot zero = 0;
zero.setdefaultcolor(color.black);

addlabel(yes," POC ",createcolor(100,0,255));

input pricePerRowHeightMode = {default TICKSIZE, AUTOMATIC};
input timePerProfile = {default Bar, CHART};
def onExpansion = no;
def period;
switch (timePerProfile) {
case CHART:
period = 0;
case Bar:
period = BarNumber() - 1;}
rec count = if period != period[1] then (count[1] + period - period[1]) % 20 else count[1];
def cond = count < count[1] + period - period[1];
def height;
switch (pricePerRowHeightMode) {
case AUTOMATIC:
height = PricePerRow.AUTOMATIC;
case TICKSIZE:
height = PricePerRow.TICKSIZE;}
profile vol = VolumeProfile("startNewProfile" = cond, "onExpansion" = onExpansion, "numberOfProfiles" = 1000, "pricePerRow" = height, "value area percent" = 68);
def con = CompoundValue(1, onExpansion, no);
def pc = if IsNaN(vol.GetPointOfControl()) and con then pc[1] else vol.GetPointOfControl();
def plotsDomain = IsNaN(close) == onExpansion;
vol.Show(CreateColor(40,60,80));

plot POC = if plotsDomain then pc else Double.NaN;
POC.setpaintingstrategy(paintingstrategy.horizontal);
POC.setdefaultcolor(createcolor(100,0,255));
POC.setlineweight(3);
POC.hidebubble();
POC.hidetitle();

profile tpo = timeProfile("startNewProfile" = cond, "onExpansion" = onExpansion, "numberOfProfiles" = 1000, "pricePerRow" = height, "value area percent" = 68);
def tpoPC = if IsNaN(tpo.getPointOfControl()) and con then tpoPC[1] else tpo.getPointOfControl();
plot tpoPOC = if plotsDomain then tpoPC else Double.NaN;
tpoPOC.setpaintingstrategy(paintingstrategy.horizontal);
tpoPOC.setdefaultcolor(createcolor(100,0,255));
tpoPOC.setlineweight(3);
tpoPOC.hidebubble();
tpoPOC.hidetitle();

### POC extensions

def y= if !IsNaN(pc) then pc else y[1];
plot vpocext = y[20];
vpocext.SetDefaultColor(CreateColor(100,0,255));
vpocext.SetPaintingStrategy(PaintingStrategy.HORIZONTAL);
vpocext.SetStyle(Curve.SHORT_DASH);
vpocext.HideBubble();
vpocext.HideTitle();

def x = if !IsNaN(tpoPC) then tpopc else x[1];
plot tpoext = x[20];
tpoext.SetDefaultColor(CreateColor(100,0,255));
tpoext.SetPaintingStrategy(PaintingStrategy.HORIZONTAL);
tpoext.SetStyle(Curve.SHORT_DASH);
tpoext.HideBubble();
tpoext.HideTitle();
Last edited by a moderator: