Next Earnings Column / Label For ThinkOrSwim

I have blended an earnings date script from Robert Payne and an AddLabel script from Mobius. It works fine for earnings dates up to five days in the past (as it should via the script) and for earnings dates in the next month (September). But when it goes out to the following months (October +) it makes all of the dates 10/14/2024. It did the same thing before I changed the AddLabel script so the issue appears to be in the earlier lines.

Code:
## watchlist column for earnings release date
## Robert Payne
def PE = GetEventOffset(Events.EARNINGS, -1);
def NE = GetEventOffset(Events.EARNINGS, 0);
def z = if PE <= 5 then PE else NE;

## get the earnings date (original of Payne now # to keep as comment)
#def eDay = GetValue(GetDayOfMonth(GetYYYYMMDD()), z);
#def eMonth = GetValue(GetMonth(), z);

## get the earnings date (from Mobius but tweaked to blend with Payne formula)
def data=GetValue(GetYYYYMMDD(),z);
def year=Round(data/10000,0);
def month=Round((data%10000)/100,0);
def day=(data%100);

AddLabel(1,month+"/"+day+"/"+AsPrice(year),if z<=0 then color.CYAN else color.WHITE);

End Code

Here is the results. I added KR to the Mag7 watchlist so you could see a September earnings date. KR is perfect, NVDA is perfect, AAPL should be 10/31, AMZN should be 10/24, GOOG should be 10/22, META should be 10/30, MSFT should be 10/22, and TSLA should be 10/16. I can't find the error. Can anyone help me? I love the script and it will work somewhat but I would like to know why ToS system pulls the correct next Earnings Date but not my script.

i think column studies, can only look ahead 30 days?

load your code as an upper chart study, set to day, and set expansion to 200
compare to the column study
load AMGN
next earnings is on,
on chart, 11/5
on column, 10/14

add this label to chart study, to rule out conversions and formulas,
addlabel(1, ne);
-46 days away

add that label to column study, to replace original label.
max out at -30

in the column study, try different times.
at 2 days, the number changes to -15 , so still 30 days
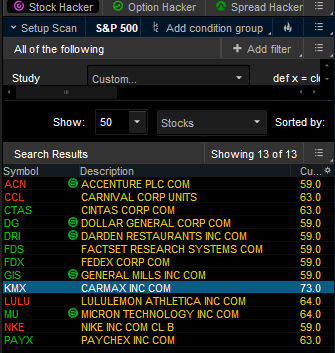
Thanks, halcyonguy. I believe I may have found an answer in the column study as well. It is from Joshua from 12/26/2023. Below is his code. It works on my scan. I'm now trying to integrate it into Earnings Date script. If I get it to work, I'll post the final version here.

Here is Joshua's code:

Code:
def x = close[-93];
def y = geteventOffset(events.earnings) + (isNaN(x) * 0);
def z = if !isNaN(close) then y else z[1];
plot Column = absValue(z);
io49IeA.png
ALRIGHT!!! I got it to work perfectly in my custom column for the watchlist. Also works in custom columns on the Monitor page under Activity and Positions. Here is the "cleaned up" code:

Code:
## watchlist column for earnings release date
## The first portion of the code (PE and NE) are from Robert Payne
## The second portion of the code that allows more than 30 bars of info is Joshua (an expert here in this group who provided the code on 12/26/2023 for another member ChuckNZ)
## The third portion of the code that formats the label is from Mobius from another post I found somewhere on the internet.

## get the earnings days to event

def PE = GetEventOffset(Events.EARNINGS, -1);
def x = close[-93];
def y=geteventoffset(events.earnings)+(isNaN(x)*0);
def NE=if !isNaN(close) then y else NE[1];
def z = if PE <= 5 then PE else NE;

## format the days into a date MM/DD/YYY

def data=GetValue(GetYYYYMMDD(),z);
def year=Round(data/10000,0);
def month=Round((data%10000)/100,0);
def day=(data%100);

## create the label for the column with white as the past earnings (PE) and cyan as the next earnings (NE)

AddLabel(1,month+"/"+day+"/"+AsPrice(year),if z<=0 then color.CYAN else color.WHITE);


1725209431096.png
 
ALRIGHT!!! I got it to work perfectly in my custom column for the watchlist. Also works in custom columns on the Monitor page under Activity and Positions. Here is the "cleaned up" code:

Code:
## watchlist column for earnings release date
## The first portion of the code (PE and NE) are from Robert Payne
## The second portion of the code that allows more than 30 bars of info is Joshua (an expert here in this group who provided the code on 12/26/2023 for another member ChuckNZ)
## The third portion of the code that formats the label is from Mobius from another post I found somewhere on the internet.

## get the earnings days to event

def PE = GetEventOffset(Events.EARNINGS, -1);
def x = close[-93];
def y=geteventoffset(events.earnings)+(isNaN(x)*0);
def NE=if !isNaN(close) then y else NE[1];
def z = if PE <= 5 then PE else NE;

## format the days into a date MM/DD/YYY

def data=GetValue(GetYYYYMMDD(),z);
def year=Round(data/10000,0);
def month=Round((data%10000)/100,0);
def day=(data%100);

## create the label for the column with white as the past earnings (PE) and cyan as the next earnings (NE)

AddLabel(1,month+"/"+day+"/"+AsPrice(year),if z<=0 then color.CYAN else color.WHITE);


View attachment 22794

This works great thanks.

For ETFs and other assets that do not have earnings dates, the script will print "N/A/N/A/N/A" in the date column ....try replacing the AddLabel() statement with the following statement as a workaround to print a blank space where there is no earnings date available...

AddLabel(1,If ISNaN(PE) then " " else month+"/"+day+"/"+AsPrice(year), if z<=0 then color.CYAN else color.WHITE);

Thanks. I've added your suggestion to my script. It cleaned up my "N/A/N/A/N/A".
 
Last edited by a moderator:

Join useThinkScript to post your question to a community of 21,000+ developers and traders.

Similar threads

Not the exact question you're looking for?

Start a new thread and receive assistance from our community.

87k+ Posts
255 Online
Create Post

Similar threads

Similar threads

The Market Trading Game Changer

Join 2,500+ subscribers inside the useThinkScript VIP Membership Club
  • Exclusive indicators
  • Proven strategies & setups
  • Private Discord community
  • ‘Buy The Dip’ signal alerts
  • Exclusive members-only content
  • Add-ons and resources
  • 1 full year of unlimited support

Frequently Asked Questions

What is useThinkScript?

useThinkScript is the #1 community of stock market investors using indicators and other tools to power their trading strategies. Traders of all skill levels use our forums to learn about scripting and indicators, help each other, and discover new ways to gain an edge in the markets.

How do I get started?

We get it. Our forum can be intimidating, if not overwhelming. With thousands of topics, tens of thousands of posts, our community has created an incredibly deep knowledge base for stock traders. No one can ever exhaust every resource provided on our site.

If you are new, or just looking for guidance, here are some helpful links to get you started.

What are the benefits of VIP Membership?
VIP members get exclusive access to these proven and tested premium indicators: Buy the Dip, Advanced Market Moves 2.0, Take Profit, and Volatility Trading Range. In addition, VIP members get access to over 50 VIP-only custom indicators, add-ons, and strategies, private VIP-only forums, private Discord channel to discuss trades and strategies in real-time, customer support, trade alerts, and much more. Learn all about VIP membership here.
How can I access the premium indicators?
To access the premium indicators, which are plug and play ready, sign up for VIP membership here.
Back
Top