Next Earnings Column / Label For ThinkOrSwim

ChuckNZ

New member
VIP
A stock's next earnings date is important because earnings announcements can have a significant impact on a company's share price and the market as a whole.

Earnings announcements can provide new information that helps value stocks and decide whether to buy, sell, or avoid them. They can also reveal a lot about a company's underlying fundamentals and change expectations for how the stock may perform.

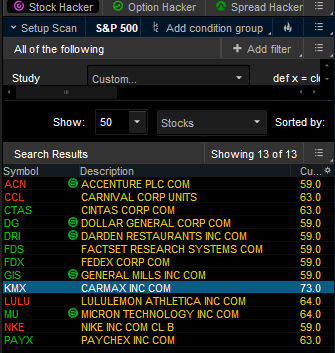
I'm trying to add a scan column that tells me the number of days to earnings announcement. It should be simple.
 
Last edited by a moderator:

Join useThinkScript to post your question to a community of 21,000+ developers and traders.

Code:
def x = close[-93];
def y = geteventOffset(events.earnings) + (isNaN(x) * 0);
def z = if !isNaN(close) then y else z[1];
plot Column = absValue(z);
io49IeA.png
 
This is a study to show the next earnings date made by Paris a few years ago. I modified it slightly to only show the date and some changes with colors. It works great on a chart (with a large expansion to the right to encompass future earnings date), but when I add it to my watchlist as a column it can't go further out then 30 days. It's correct on anything sooner than that, but if it's farther out than 30 bars it just outputs the date 30 bars away. Any suggestions?

Thanks in advance

# Next Earnings Date
# Paris
# 10.15.2019

# You have to have enough expansion area on your chart available to reach the actual Earnings date, so if you have 0 expansion area, an inconsistent date will be displayed

#HINT: watchlist label that shows days-to-earnings and next earnings date (if next earnings date is available). Includes a visual alert if "EARNINGS TODAY"

#def allows you to teach ThinkScript new "words" to save time and typing by using your new "words" later in the code
def bn = BarNumber();
def na = Double.NaN;
def getNextEarnings = AbsValue(GetEventOffset(Events.EARNINGS, 0));
def findDay = GetDayOfMonth(GetYYYYMMDD());
def findMonth = GetMonth();
def findYear = GetYear();

#ThinkScript thinks in numbers, including converting dates into numbers and viewing each bar on the chart as a number. Therefore you can use BarNumber to tell ThinkScript which bar, and use lines in ThinkScript code to 'trick' ThinkScript into displaying that daily bar in date format
def getNextEarningsBarNumber = if !isNaN(getNextEarnings) then bn + getNextEarnings else na;
def NextEarnings = bn == HighestAll(getNextEarningsBarNumber);
def getNextEarningsMonth = HighestAll(if NextEarnings then findMonth else na);
def getNextEarningsDay = HighestAll(if NextEarnings then findDay else na);
def getNextEarningsYear = HighestAll(if NextEarnings then findYear else na);

#plot tells ThinkScript what data you want displayed. Hide() is used in this case because desired display is the label and not the numberic equivalent of the data
plot DaysToEarnings = getNextEarningsBarNumber;
DaysToEarnings.Hide();

AddLabel(getNextEarnings > 5, getNextEarningsMonth + "/" + getNextEarningsDay + "/" + AsPrice(getNextEarningsYear), Color.Green);
AddLabel(getNextEarnings between 1 and 5, getNextEarningsMonth + "/" + getNextEarningsDay + "/" + AsPrice(getNextEarningsYear), Color.Yellow);
AddLabel(getNextEarnings == 0, " EARNINGS TODAY ", Color.Red);
# End Next Earnings Date
 
Similar to Joshua/Paris's code, this seems to work

Screenshot 2024-03-13 235814.png
Code:
def lastbar = (if IsNaN(close[-1]) and !IsNaN(close) then BarNumber() else Double.NaN);

def days = absvalue(GetEventOffset(Events.EARNINGS));
def day  = HighestAll(if BarNumber() == HighestAll(lastbar + days) then GetDayOfMonth(GetYYYYMMDD()) else Double.NaN);
def mon  = HighestAll(if BarNumber() == HighestAll(lastbar + days) then GetMonth() else Double.NaN);
def year = HighestAll(if BarNumber() == HighestAll(lastbar + days) then GetYear() - 2000 else Double.NaN);

AddLabel(1, mon + "/" + day + "/" + year);
 
Last edited:
A stock's next earnings date is important because earnings announcements can have a significant impact on a company's share price and the market as a whole.

Earnings announcements can provide new information that helps value stocks and decide whether to buy, sell, or avoid them. They can also reveal a lot about a company's underlying fundamentals and change expectations for how the stock may perform.

HlkhBBF.png


How to make this Earning date shows as a column?
Find answer below.
 
Last edited by a moderator:
this actually took me forever to figure out how to get past the 30D forward looking bar (days) restriction in ToS. Learned a few things.

here you go
NEXT EARNINGS DATE WITH BEFORE OPEN OR AFTER MARKET CLOSE LABEL or COLUMN v3.0
NOTE: THE CODE IS ADJUSTABLE TO SHOW WITH OR WITHOUT THE DATE

AS A COLUMN:
*MUST BE ON DAY AGGREGATION <-------- PEOPLE WILL STILL FORGET THIS AND SAY IT DOESN'T WORK, BUT IT DOES WORK
.
.
AS A CHART LABEL:
go to CHARTS SETTINGS>TIME AXIS>
*MUST BE ON DAY AGGREGATION & EXPANSION AREA 100 BARS TO RIGHT <-------- PEOPLE WILL STILL FORGET THIS AND SAY IT DOESN'T WORK, BUT IT DOES WORK


Code:
declare lower;
# NEXT EARNINGS DATE WITH BEFORE OPEN OR AFTER MARKET CLOSE LABEL or COLUMN v3.0
# by request via usethinkscript.com by XeoNoX 07/07/2024
#      *****************************************************
#      *****  AS COLUMN MUST BE ON DAY AGGREGATION    ******
#   
#
#      ****** IF USING ON A CHART MUST SET     ******
#      ******      AGGREGATION TO DAY          ******
#      ******           AND                    ******
#      ****** EXPANSION AREA 100 BARS TO RIGHT ******
#      ****** Go to CHART SETTINGS > TIME AXIS ******
#      *****************************************************
############################################################
#INPUT "YES" or "NO" TO SHOW YEAR
input showyear=YES;
########################################
#Special thanks to @Joshua/@Paris from usethinkscript.com for the 30D limitation bypass
#30D Bypass CODE START
def length = close[-93];
def ER = geteventOffset(events.earnings) + (isNaN(length) * 0);
def ERbar = if !isNaN(close) then ER else ERbar[1];
def daysaway = absValue(ERbar);
#30D Bypass CODE END
##########################################
def before = HasEarnings(type = EarningTime.BEFORE_MARKET);
def after = HasEarnings(type = EarningTime.AFTER_MARKET);
def beforebar = if before then (BarNumber()) else beforebar[1];
def afterbar = if after then (BarNumber()) else afterbar[1];
def beforebarh = HighestAll(beforebar);
def affterbarh = HighestAll(afterbar);
def BarIsAfter = if  affterbarh > beforebarh then 1 else  0;
def lastbar = (if IsNaN(close[-1]) and !IsNaN(close) then BarNumber() else Double.NaN);
def day  = HighestAll(if BarNumber() == HighestAll(lastbar + daysaway) then GetDayOfMonth(GetYYYYMMDD()) else Double.NaN);
def month  = HighestAll(if BarNumber() == HighestAll(lastbar + daysaway) then GetMonth() else Double.NaN);
def year = HighestAll(if BarNumber() == HighestAll(lastbar + daysaway) then GetYear() - 2000 else Double.NaN);
AddLabel(1,  if ISNAN(day) then "No Earnings" else (if month>9 then "" else "0") + month+ "/" + (if day>9 then "" else "0")+ day + "/"+ (if ShowYear==YES then asprice(year) else "") + (if BarIsAfter then " (A)" else  " (B)" ), Color.gray);

NOTE: THE CODE IS ADJUSTABLE TO SHOW EITHER WITH OR WITHOUT THE DATE

SCREENSHOT OF WITHOUT THE YEAR
1720402074755.png


SCREENSHOT WITH THE YEAR

1720402129134.png
 
Last edited:
this actually took me forever to figure out how to get past the 30D forward looking bar (days) restriction in ToS. Learned a few things.

here you go
NEXT EARNINGS DATE WITH BEFORE OPEN OR AFTER MARKET CLOSE LABEL or COLUMN v1.0
NOTE: THE CODE IS ADJUSTABLE TO SHOW WITH OR WITHOUT THE DATE
*MUST BE ON DAY AGGREGATION <-------- PEOPLE WILL STILL FORGET THIS AND SAY IT DOESN'T WORK, BUT IT DOES WORK

Code:
declare lower;
# NEXT EARNINGS DATE WITH BEFORE OPEN OR AFTER MARKET CLOSE LABEL or COLUMN v2.0
# by request via usethinkscript.com by XeoNoX 07/07/2024
#           *********************************
#           ****MUST BE ON DAY AGGREGATION***
#           *********************************
#######################################
#INPUT "YES" or "NO" TO SHOW YEAR
input showyear=YES;
########################################
#Special thanks to @Joshua/@Paris from usethinkscript.com for the 30D limitation bypass
#30D Bypass CODE START
def length = close[-93];
def ER = geteventOffset(events.earnings) + (isNaN(length) * 0);
def ERbar = if !isNaN(close) then ER else ERbar[1];
def daysaway = absValue(ERbar);
#30D Bypass CODE END
##########################################
def before = HasEarnings(type = EarningTime.BEFORE_MARKET);
def after = HasEarnings(type = EarningTime.AFTER_MARKET);
def beforebar = if before then (BarNumber()) else beforebar[1];
def afterbar = if after then (BarNumber()) else afterbar[1];
def beforebarh = HighestAll(beforebar);
def affterbarh = HighestAll(afterbar);
def BarIsAfter = if  affterbarh > beforebarh then 1 else  0;
def lastbar = (if IsNaN(close[-1]) and !IsNaN(close) then BarNumber() else Double.NaN);
def day  = HighestAll(if BarNumber() == HighestAll(lastbar + daysaway) then GetDayOfMonth(GetYYYYMMDD()) else Double.NaN);
def month  = HighestAll(if BarNumber() == HighestAll(lastbar + daysaway) then GetMonth() else Double.NaN);
def year = HighestAll(if BarNumber() == HighestAll(lastbar + daysaway) then GetYear() - 2000 else Double.NaN);
AddLabel(1,  if ISNAN(day) then "No Earnings" else (if month>9 then "" else "0") + month+ "/" + (if day>9 then "" else "0")+ day + "/"+ (if ShowYear==YES then asprice(year) else "") + (if BarIsAfter then " (A)" else  " (B)" ), Color.gray);

NOTE: THE CODE IS ADJUSTABLE TO SHOW EITHER WITH OR WITHOUT THE DATE

SCREENSHOT OF WITHOUT THE YEAR
View attachment 22323

SCREENSHOT WITH THE YEAR

View attachment 22324
it always shows the same date for all stocks
 
it always shows the same date for all stocks

oh, i think i know what you did, it works fine on Columns just setting aggegation. But on a chart as a label you have to take an extra step and set the expansion area as well. please make sure you have a minimum of 3 months (atleast 100 days), which in this case are bars) visible both forward looking and back looking on the daily chart. thanks for bringing this to my attention, i will update the original post with this information.

dayagg.png
 
Last edited:
oh, i think i know what you did, it works fine on Columns just setting aggegation. But on a chart as a label you have to take an extra step and set the expansion area as well. please make sure you have a minimum of 3 months (atleast 100 days), which in this case are bars) visible both forward looking and back looking on the daily chart. thanks for bringing this to my attention, i will update the original post with this information.

View attachment 22338
Thanks XeoNox, it works perfectly by changing the expansion area. Thank you!
 
I want the earning in the next coming 7 days, next week, why this scan shows me few stocks that from JAN-JUNE?

If you are asking, is it possible that some companies do not update their data feeds with their projected earnings dates correctly, and therefore we occasionally get conflicting data in the various fields?

Yes, it is absolutely possible. However, this is one of the most important fields that we have available for basing our most significant trading moves. So, we live with the infrequent garbage data.
Trade carefully on instruments with bad data fields. It is not a good omen for foretelling a well-run company.
 
Here is a "Days 'til Erns" Column that I have used since 2016.
It's not perfect but it suits my needs as a position investor.
Code:
# Created Circa 2016 from Code by Stan Latoz
# Markos
# 0.5 is "generally" AMC that day and 1.0 is before market open, afaik.
input length = 60;
def xx= -geteventOffset(events.EARNINGS);
def yy = sum(hasEarnings(type = earningTime.AFTER_MARKET),length)[-length +1] >0;
plot x=xx+yy*.5;
x.assignvaluecolor( if yy!=0 then color.LIGHT_RED else color.Yellow);
#End Code

(It goes out 59 days)
1723693783344.png
 
Here is a chart label for Days 'til Earnings.
It's basic, you can add color if you wish. For me it's just a heads up reminder.
If earnings are less than 15 days out it will tell you AMC or BMO.
1723694596775.png
1723694718067.png
1723695176347.png
<< the EMA/SMA labels are included, they change to Magenta when price is below.
BTW, my expansion is only 15 days with this label code.

Below is the complete code from Chris Ball when the TOS Yahoo Group was running. No date in header but I beleive it was around 2012.
Code:
#Chris' All in One Labels
#################################################
# Heads Up Display
#################################################
# ***************** Define *************************
def LastPrice = close(PriceType = "LAST");
def Daily = close(Period = "day");
#def RSI = reference RSI(length = 14, price = close(period = "day" )).RSI;
#def VWAP = vwap(Period = "day");
def EMA8Day = ExpAverage(Daily, 8);
def EMA13Day = ExpAverage(Daily, 13);
def EMA21Day = ExpAverage(Daily, 21);
def EMA65Day = ExpAverage(Daily, 65);
def SMA50Day = Average(Daily, 50);
#def SMA100Day = Average(Daily, 100);
def SMA200Day = Average(Daily, 200);
#def SMA50Day1 = SMA50Day >= Average(Daily, 200);
#def SMA200Day1 = SMA50Day < Average(Daily, 200);
#def DailyVol = volume(period = "day");
#def AvgVol = (volume(period = ”DAY”)[1] + volume(period = ”DAY”)[2] + volume(period = ”DAY”)[3] + volume(period = ”DAY”)[4] + volume(period = ”DAY”)[5] + volume(period = ”DAY”)[6] + volume(period = ”DAY”)[7] + volume(period = ”DAY”)[8] + volume(period = ”DAY”)[9] + volume(period = ”DAY”)[10]) / 10;
###Earnings Data
def LastEarningsBar = AbsValue(GetEventOffset(Events.EARNINGS, 0));
def NextEarnings = if IsNaN(LastEarningsBar) then 0 else LastEarningsBar;
def ERlength = 30;
def earnings = HasEarnings();
def before = HasEarnings(type = EarningTime.BEFORE_MARKET);
def after =  HasEarnings(type = EarningTime.AFTER_MARKET);
def anytime = HasEarnings();
def before1 = Sum(before, ERlength)[-ERlength + 1] > 0;
def after1 = Sum(after, ERlength)[-ERlength + 1] > 0;
def anytime1 = Sum(anytime, ERlength)[-ERlength + 1] > 0;

# ***************** Labels *************************
input Show_Label_Box = yes;

#AddLabel(Show_Label_Box, "Volume: " + DailyVol, if DailyVol > AvgVol then Color.GREEN else Color.GRAY);
AddLabel(Show_Label_Box, "ER < " + NextEarnings + " Days " + if before1 then "BMO" else if after1 then "AMC" else if anytime1 then "Unknown time" else "No", Color.light_gray);
#AddLabel(Show_Label_Box, "RSI: " + Round(RSI, 2), if RSI > 70 then Color.RED else if RSI < 30 then Color.GREEN else Color.YELLOW);
#AddLabel(Show_Label_Box, "Last: " + LastPrice, Color.WHITE);#was "PM/AH: " + LastPrice, color.gray
#AddLabel(Show_Label_Box, "VWAP: " + Round(VWAP, 2), if Daily > VWAP then Color.Cyan else Color.Magenta);
#AddLabel(Show_Label_Box, "Golden Cross", if SMA50Day1 then Color.GREEN else Color.RED);
AddLabel(Show_Label_Box, "8EMA: " + Round(EMA8Day, 1), if close > EMA13Day then color.cyan else Color.Magenta);
AddLabel(Show_Label_Box, "13EMA: " + Round(EMA13Day, 1), if close > EMA13Day then color.cyan else Color.Magenta);
AddLabel(Show_Label_Box, "21EMA: " + Round(EMA21Day, 1), if close > EMA21Day then color.cyan else Color.Magenta);
#AddLabel(Show_Label_Box, "65EMA: " + Round(EMA65Day, 1), if close > EMA65Day then color.cyan else Color.Magenta);
AddLabel(Show_Label_Box, "50SMA: " + Round(SMA50Day, 1), if close > SMA50Day then color.cyan else Color.Magenta);
#AddLabel(Show_Label_Box, "Daily 100sma: " + Round(SMA100Day, 2), if close > SMA100Day then color.blue else Color.RED);
AddLabel(Show_Label_Box, "200SMA: " + Round(SMA200Day, 1), if close > SMA200Day then color.cyan else Color.Magenta);#was color.green,red

#End Code
 
I entered the code as a study and saved it. But when I try to add it to a column in a WatchList it does not appear in the list of Studies. Any help greatly appreciated.

I'm sure this code works. But my problem is that I can't seem to get into a Watchlist column. When I do customize on the WL to and bring up the dialog box, on the left there is "available Items" and bellow that I select Studies, but then I don't find this study. (I did add and save it, and I do find it when I want to put it on a Chart but not when I want to put it on a WL.
 
Last edited by a moderator:
I have blended an earnings date script from Robert Payne and an AddLabel script from Mobius. It works fine for earnings dates up to five days in the past (as it should via the script) and for earnings dates in the next month (September). But when it goes out to the following months (October +) it makes all of the dates 10/14/2024. It did the same thing before I changed the AddLabel script so the issue appears to be in the earlier lines.

Code:
## watchlist column for earnings release date
## Robert Payne
def PE = GetEventOffset(Events.EARNINGS, -1);
def NE = GetEventOffset(Events.EARNINGS, 0);
def z = if PE <= 5 then PE else NE;

## get the earnings date (original of Payne now # to keep as comment)
#def eDay = GetValue(GetDayOfMonth(GetYYYYMMDD()), z);
#def eMonth = GetValue(GetMonth(), z);

## get the earnings date (from Mobius but tweaked to blend with Payne formula)
def data=GetValue(GetYYYYMMDD(),z);
def year=Round(data/10000,0);
def month=Round((data%10000)/100,0);
def day=(data%100);

AddLabel(1,month+"/"+day+"/"+AsPrice(year),if z<=0 then color.CYAN else color.WHITE);

End Code

Here is the results. I added KR to the Mag7 watchlist so you could see a September earnings date. KR is perfect, NVDA is perfect, AAPL should be 10/31, AMZN should be 10/24, GOOG should be 10/22, META should be 10/30, MSFT should be 10/22, and TSLA should be 10/16. I can't find the error. Can anyone help me? I love the script and it will work somewhat but I would like to know why ToS system pulls the correct next Earnings Date but not my script.

1725115133993.png
 
Update on results ... it appears that the correct date will appear through next six weeks (today is 9/1 and I can see accurate results through 10/11). Or is this through a number of bars (Daily which would make it 30 bars)?
 
More update on results ... I've just pulled a condition search on GetEventOffset("eventType"=Events.EARNINGS) and it pulls "days to the event" as a negative number. For example, the KR ticker (showing current Earnings Date of 9/12/2024) shows -8.0 which means 9/12 is eight bars (Daily) until earnings. The max days (for tickers with earnings further out) is all at -30.0 which fairly represents my problems.

Here is the question ... when I pull earnings dates on MarketWatch, it gives me the correct Earnings Date even further out than -30.0 ... is there something in my thinkscript where I can tell it to go out further than 30 bars into the future?
 

Similar threads

Not the exact question you're looking for?

Start a new thread and receive assistance from our community.

87k+ Posts
442 Online
Create Post

Similar threads

Similar threads

The Market Trading Game Changer

Join 2,500+ subscribers inside the useThinkScript VIP Membership Club
  • Exclusive indicators
  • Proven strategies & setups
  • Private Discord community
  • ‘Buy The Dip’ signal alerts
  • Exclusive members-only content
  • Add-ons and resources
  • 1 full year of unlimited support

Frequently Asked Questions

What is useThinkScript?

useThinkScript is the #1 community of stock market investors using indicators and other tools to power their trading strategies. Traders of all skill levels use our forums to learn about scripting and indicators, help each other, and discover new ways to gain an edge in the markets.

How do I get started?

We get it. Our forum can be intimidating, if not overwhelming. With thousands of topics, tens of thousands of posts, our community has created an incredibly deep knowledge base for stock traders. No one can ever exhaust every resource provided on our site.

If you are new, or just looking for guidance, here are some helpful links to get you started.

What are the benefits of VIP Membership?
VIP members get exclusive access to these proven and tested premium indicators: Buy the Dip, Advanced Market Moves 2.0, Take Profit, and Volatility Trading Range. In addition, VIP members get access to over 50 VIP-only custom indicators, add-ons, and strategies, private VIP-only forums, private Discord channel to discuss trades and strategies in real-time, customer support, trade alerts, and much more. Learn all about VIP membership here.
How can I access the premium indicators?
To access the premium indicators, which are plug and play ready, sign up for VIP membership here.
Back
Top