azakusa
Member
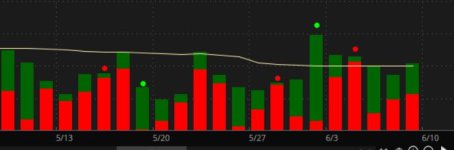
Lately I have been using a mixed volume visual indicator with some success.
I got it somewhere here on usethinkscript, and really helps provide that subtle additional confirmation to real-time setups as they are playing out.
The issue is that its quite hard to see vol candles and PA at the same time, without zooming in quite deeply, and its got me thinking that an additional visual signal would be amazing.
Is there a way to code it so that an arrow or a dot or some visual indication appears in the volume panel over any vol candle that is all red or all green (or nearly so)? This way I could see it at a glance when playing the 1m on fast movers.
Here is the code I have been using for the visual.
Note I added the avg vol line and label myself, but I am in no way a coder, so it may not be perfect.
That said, I think its working fine and have been using it to help confirm entries for some time now.
---------------------------
#Mixed_Vol_Avg_Label
declare lower;
declare zerobase;
input length = 50;
plot VolAvg = Average(volume, length);
VolAvg.SetDefaultColor(GetColor(8));
#Inputs
input ShowSellVolumePercent = yes;
def O = open;
def H = high;
def C = close;
def L = low;
def V = volume;
def Buying = V*(C-L)/(H-L);
def Selling = V*(H-C)/(H-L);
#Volume Data
def today = volume(period = "DAY");
def curVolume = volume;
def SellVolPercent = Round((Selling / Volume) * 100, 0);
# Selling Volume
Plot SV = selling;
SV.setPaintingStrategy(PaintingStrategy.Histogram);
SV.SetDefaultColor(Color.Red);
SV.HideTitle();
SV.HideBubble();
SV.SetLineWeight(5);
# Buying Volume
# Plot BV = Buying;
# Note that Selling + Buying Volume = Volume.
Plot BV = volume;
BV.setPaintingStrategy(PaintingStrategy.Histogram);
BV.SetDefaultColor(Color.Dark_Green);
BV.HideTitle();
BV.HideBubble();
BV.SetLineWeight(5);
# Labels
AddLabel(ShowSellVolumePercent, "Cur Bar Sell %: " + SellVolPercent, (if SellVolPercent > 51 then Color.RED else if SellVolPercent < 49 then Color.GREEN else Color.ORANGE));
Last edited: