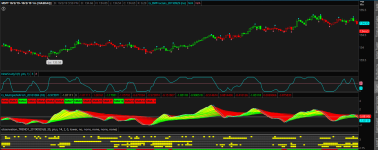
Multiple moving averages of the Fish For ThinkOrSwim

asianboy

New member
2010-01-07_1853.png


from http://share-tos.blogspot.com/2010/01/multiple-moving-averages-of-fish.html

Code:
# Multiple moving averages of the Fish

#by Wavetrader » Mon Oct 26, 2009 8:53 pm

#

#


declare lower;


input length = 10;


def maxHigh = Highest(high, length);

def minLow = Lowest(low, length);


rec value = if maxHigh - minLow == 0 then 0 else 0.66 * ((close - minLow) / (maxHigh - minLow) - 0.5) + 0.67 * value[1];


def truncValue = if value > 0.99 then 0.999 else if value < -0.99 then -0.999 else value; rec fish = 0.5 * (log((1 + truncValue) / (1 - truncValue)) + fish[1]); plot FTOneBarBack = fish[1]; FTOneBarBack.SetDefaultColor(GetColor(1)); plot FT = fish; FT.SetDefaultColor(GetColor(8)); plot ZeroLine = 0; ZeroLine.SetDefaultColor(GetColor(3)); plot SMA = simpleMovingAvg(ft, 1); plot SMA1 = simpleMovingAvg(ft, 5); plot SMA2 = simpleMovingAvg(ft, 10); plot SMA3 = simpleMovingAvg(ft, 15); plot SMA4 = simpleMovingAvg(ft, 20); plot SMA5 = simpleMovingAvg(ft, 30); plot SMA6 = simpleMovingAvg(ft, 40); plot SMA7 = simpleMovingAvg(ft, 7); plot SMA8 = simpleMovingAvg(ft, 3); plot SMA9 = simpleMovingAvg(ft, 25); plot SMA10 = simpleMovingAvg(ft, 50); plot SMA11 = simpleMovingAvg(ft, 35); plot SMA12 = simpleMovingAvg(ft, 7); plot SMA13 = simpleMovingAvg(ft, 45); plot SMA14 = simpleMovingAvg(ft, 17); AddCloud(sma, sma10); AddCloud(sma, sma6); AddCloud(sma, sma3); AddCloud(sma, sma1); AddCloud(sma, sma2); AddCloud(sma, sma4); AddCloud(sma, sma5); AddCloud(sma, sma7); AddCloud(sma, sma9); AddCloud(sma, sma11); AddCloud(sma, sma12); AddCloud(sma, sma13); AddCloud(sma, sma14); SMA.AssignValueColor(if ft > SMA[1] then color.green else color.red);

SMA1.AssignValueColor(if ft > SMA1[1] then color.green else color.red);

SMA2.AssignValueColor(if ft > SMA2[1] then color.green else color.red);

SMA3.AssignValueColor(if ft > SMA3[1] then color.green else color.red);

SMA4.AssignValueColor(if ft > SMA4[1] then color.green else color.red);

SMA5.AssignValueColor(if ft > SMA5[1] then color.green else color.red);

SMA6.AssignValueColor(if ft > SMA6[1] then color.green else color.red);

SMA7.AssignValueColor(if ft > SMA7[1] then color.green else color.red);

SMA8.AssignValueColor(if ft > SMA8[1] then color.green else color.red);

SMA9.AssignValueColor(if ft > SMA9[1] then color.green else color.red);

SMA10.AssignValueColor(if ft > SMA10[1] then color.green else color.red);

SMA11.AssignValueColor(if ft > SMA11[1] then color.green else color.red);

SMA12.AssignValueColor(if ft > SMA12[1] then color.green else color.red);

SMA13.AssignValueColor(if ft > SMA13[1] then color.green else color.red);

SMA14.AssignValueColor(if ft > SMA14[1] then color.green else color.red);
 
thanks for sharing I think some of the logic from the ribbon can be turned into an exit/stop indicator - I need to isolate the logic and think can turn this into stop indicator to get out of an existing trade to lock profit. look at the line when it hits the bottom, seems like a good time to exit a trade.

KMxZWXX.png


Stop signal is generated when line cross zeroline (red line).
 

Attachments

  • KMxZWXX.png
    KMxZWXX.png
    273.6 KB · Views: 237
Last edited:
thanks for sharing I think some of the logic from the ribbon can be turned into an exit/stop indicator - I need to isolate the logic and think can turn this into stop indicator to get out of an existing trade to lock profit. look at the line when it hits the bottom, seems like a good time to exit a trade.

KMxZWXX.png


Stop signal is generated when line cross zeroline (red line).
that observation trend is something i'm really interested in is there anywhere i can find something like this? thanks
 

Attachments

  • KMxZWXX.png
    KMxZWXX.png
    273.6 KB · Views: 213
that observation trend is something i'm really interested in is there anywhere i can find something like this? thanks
welcome to the community! - let me provide you a few links to help you get started. there are many trend following indicators here, from ma's to a number of published indicators.

please look at link1 link2 link3 also please share the type of trader that you are, and the types of position you take, this will help refine the feedback.
not sure that's what i'm looking for i think you thought i was talking about the top part but i meant the bottom posted picture you see the trend indicator you have on the bottom observation trend, that's what i'm trying to work on, just something simple like this but I can't get it right.
 
thanks for sharing I think some of the logic from the ribbon can be turned into an exit/stop indicator - I need to isolate the logic and think can turn this into stop indicator to get out of an existing trade to lock profit. look at the line when it hits the bottom, seems like a good time to exit a trade.

KMxZWXX.png


Stop signal is generated when line cross zeroline (red line).
@diazlaz what is the bottom study called? Do you have the script for it?
 

Attachments

  • KMxZWXX.png
    KMxZWXX.png
    273.6 KB · Views: 205
Here is an updated version, Added arrows, paintbars, and Labels
Code:
# Multiple moving averages of the Fish
#by Wavetrader » Mon Oct 26, 2009 8:53 pm
#Ammended by Henry Kaczmarczyk Sun Aug 22, 2021 4:25 pm
#Cleaned up the MA's
#Added setLineWeights for FT, FTOneBarBack
#Added Arrows based on FT crossing FTOneBarBack
#Added PaintBars Based on FT crossing FTOneBarBack
#Added Labels based on FT crossing SMA's
declare lower;
input length = 10;
input Arrows = yes;
Input Dotsize = 3;
input paintbars = yes;
Input Show_Labels = Yes;
def maxHigh = Highest(high, length);
def minLow = Lowest(low, length);

rec value = if maxHigh - minLow == 0 then 0 else 0.66 * ((close - minLow) / (maxHigh - minLow) - 0.5) + 0.67 * value[1];

def truncValue = if value > 0.99 then 0.999 else if value < -0.99 then -0.999 else value;
rec fish = 0.5 * (log((1 + truncValue) / (1 - truncValue)) + fish[1]);
plot FTOneBarBack = fish[1];
FTOneBarBack.SetDefaultColor(GetColor(1));
FTOneBarBack.SetLineWeight(2);
plot FT = fish;
FT.SetDefaultColor(GetColor(8));
FT.setLineWeight(2);
plot ZeroLine = 0;
ZeroLine.SetDefaultColor(GetColor(3));
plot SMA = simpleMovingAvg(ft, 1);
plot SMA1 = simpleMovingAvg(ft, 3);
plot SMA2 = simpleMovingAvg(ft, 5);
plot SMA3 = simpleMovingAvg(ft, 7);
plot SMA4 = simpleMovingAvg(ft, 10);
plot SMA5 = simpleMovingAvg(ft, 15);
plot SMA6 = simpleMovingAvg(ft, 17);
plot SMA7 = simpleMovingAvg(ft, 20);
plot SMA8 = simpleMovingAvg(ft, 25);
plot SMA9 = simpleMovingAvg(ft, 30);
plot SMA10 = simpleMovingAvg(ft, 35);
plot SMA11 = simpleMovingAvg(ft, 40);
plot SMA12 = simpleMovingAvg(ft, 45);
plot SMA13 = simpleMovingAvg(ft, 50);
AddCloud(sma, sma1);
AddCloud(sma, sma2);
AddCloud(sma, sma3);
AddCloud(sma, sma4);
AddCloud(sma, sma5);
AddCloud(sma, sma6);
AddCloud(sma, sma7);
AddCloud(sma, sma8);
AddCloud(sma, sma9);
AddCloud(sma, sma10);
AddCloud(sma, sma11);
AddCloud(sma, sma12);
AddCloud(sma, sma13);
SMA.AssignValueColor(if ft > SMA[1] then color.green else color.red);
SMA1.AssignValueColor(if ft > SMA1[1] then color.green else color.red);
SMA2.AssignValueColor(if ft > SMA2[1] then color.green else color.red);
SMA3.AssignValueColor(if ft > SMA3[1] then color.green else color.red);
SMA4.AssignValueColor(if ft > SMA4[1] then color.green else color.red);
SMA5.AssignValueColor(if ft > SMA5[1] then color.green else color.red);
SMA6.AssignValueColor(if ft > SMA6[1] then color.green else color.red);
SMA7.AssignValueColor(if ft > SMA7[1] then color.green else color.red);
SMA8.AssignValueColor(if ft > SMA8[1] then color.green else color.red);
SMA9.AssignValueColor(if ft > SMA9[1] then color.green else color.red);
SMA10.AssignValueColor(if ft > SMA10[1] then color.green else color.red);
SMA11.AssignValueColor(if ft > SMA11[1] then color.green else color.red);
SMA12.AssignValueColor(if ft > SMA12[1] then color.green else color.red);
SMA13.AssignValueColor(if ft > SMA13[1] then color.green else color.red);

#ARROWS
plot ArrowDown = if arrows and (Ft Crosses below FTOneBarBack) then FT else double.nan;
ArrowDown.setpaintingStrategy(paintingStrategy.Arrow_Down);
ArrowDown.setDefaultColor(color.Magenta);
ArrowDown.setLineWeight(dotsize);

plot ArrowUp = if arrows and (FT crosses above FTOneBarBack ) then FT else double.nan;
ArrowUp.setpaintingStrategy(paintingStrategy.Arrow_Up);
ArrowUp.setDefaultColor(color.Cyan);
ArrowUp.setLineWeight(dotsize);

AssignPriceColor( if paintbars and FT > FTOneBarBack then Color.Green else if paintbars and FT < FTOneBarBack then Color.Red else  color.current);

AddLabel(Show_labels,"SMA:" + SMA,if ft > SMA[1] then color.green else color.red);
AddLabel(Show_labels,"1MA:" + SMA1,if ft > SMA1[1] then color.green else color.red);
AddLabel(Show_labels,"2MA:" + SMA2,if ft > SMA2[1] then color.green else color.red);
AddLabel(Show_labels,"3MA:" + SMA3,if ft > SMA3[1] then color.green else color.red);
AddLabel(Show_labels,"4MA:" + SMA4,if ft > SMA4[1] then color.green else color.red);
AddLabel(Show_labels,"5MA:" + SMA5,if ft > SMA5[1] then color.green else color.red);
AddLabel(Show_labels,"6MA:" + SMA6,if ft > SMA6[1] then color.green else color.red);
AddLabel(Show_labels,"7MA:" + SMA7,if ft > SMA7[1] then color.green else color.red);
AddLabel(Show_labels,"8MA:" + SMA8,if ft > SMA8[1] then color.green else color.red);
AddLabel(Show_labels,"9MA:" + SMA9,if ft > SMA9[1] then color.green else color.red);
AddLabel(Show_labels,"10MA:" + SMA10,if ft > SMA10[1] then color.green else color.red);
AddLabel(Show_labels,"11MA:" + SMA11,if ft > SMA11[1] then color.green else color.red);
AddLabel(Show_labels,"12MA:" + SMA12,if ft > SMA12[1] then color.green else color.red);
AddLabel(Show_labels,"13MA:" + SMA13,if ft > SMA13[1] then color.green else color.red);
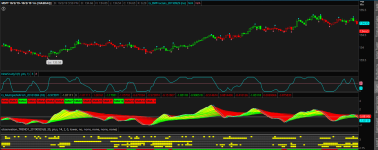
Here is the newest version which allows for the arrows to be plotted for the various crossings of the SMA's and also allows for the paintbars to paint the various SMA crossings

Code is below
Code:
# Multiple moving averages of the Fish
#by Wavetrader » Mon Oct 26, 2009 8:53 pm
#Ammended by Henry Kaczmarczyk Sun Aug 22, 2021 4:25 pm
#Ammended by Henry Kaczmarczyk Tuesday Aug 24,2021 8:51 pm
#Cleaned up the MA's
#Added setLineWeights for FT, FTOneBarBack
#Added Arrows based on FT crossing FTOneBarBack
#Newly Added the ability to show arrows from FT crossing different SMA's
#Added PaintBars Based on FT crossing Different SMA's
#Added Labels based on FT crossing SMA's
declare lower;
input length = 10;
input Arrows = 0;
# if you use 15 as the setting, no arrows will plot
Input Dotsize = 3;
input paintbars = 0;
# A setting of 15 will not paint the bars
Input Show_Labels = Yes;
def maxHigh = Highest(high, length);
def minLow = Lowest(low, length);

rec value = if maxHigh - minLow == 0 then 0 else 0.66 * ((close - minLow) / (maxHigh - minLow) - 0.5) + 0.67 * value[1];

def truncValue = if value > 0.99 then 0.999 else if value < -0.99 then -0.999 else value;
rec fish = 0.5 * (log((1 + truncValue) / (1 - truncValue)) + fish[1]);
plot FTOneBarBack = fish[1];
FTOneBarBack.SetDefaultColor(GetColor(1));
FTOneBarBack.SetLineWeight(2);
plot FT = fish;
FT.SetDefaultColor(GetColor(8));
FT.setLineWeight(2);
plot ZeroLine = 0;
ZeroLine.SetDefaultColor(GetColor(3));
plot SMA = simpleMovingAvg(ft, 1);
plot SMA1 = simpleMovingAvg(ft, 3);
plot SMA2 = simpleMovingAvg(ft, 5);
plot SMA3 = simpleMovingAvg(ft, 7);
plot SMA4 = simpleMovingAvg(ft, 10);
plot SMA5 = simpleMovingAvg(ft, 15);
plot SMA6 = simpleMovingAvg(ft, 17);
plot SMA7 = simpleMovingAvg(ft, 20);
plot SMA8 = simpleMovingAvg(ft, 25);
plot SMA9 = simpleMovingAvg(ft, 30);
plot SMA10 = simpleMovingAvg(ft, 35);
plot SMA11 = simpleMovingAvg(ft, 40);
plot SMA12 = simpleMovingAvg(ft, 45);
plot SMA13 = simpleMovingAvg(ft, 50);
AddCloud(sma, sma1);
AddCloud(sma, sma2);
AddCloud(sma, sma3);
AddCloud(sma, sma4);
AddCloud(sma, sma5);
AddCloud(sma, sma6);
AddCloud(sma, sma7);
AddCloud(sma, sma8);
AddCloud(sma, sma9);
AddCloud(sma, sma10);
AddCloud(sma, sma11);
AddCloud(sma, sma12);
AddCloud(sma, sma13);
SMA.AssignValueColor(if ft > SMA[1] then color.green else color.red);
SMA1.AssignValueColor(if ft > SMA1[1] then color.green else color.red);
SMA2.AssignValueColor(if ft > SMA2[1] then color.green else color.red);
SMA3.AssignValueColor(if ft > SMA3[1] then color.green else color.red);
SMA4.AssignValueColor(if ft > SMA4[1] then color.green else color.red);
SMA5.AssignValueColor(if ft > SMA5[1] then color.green else color.red);
SMA6.AssignValueColor(if ft > SMA6[1] then color.green else color.red);
SMA7.AssignValueColor(if ft > SMA7[1] then color.green else color.red);
SMA8.AssignValueColor(if ft > SMA8[1] then color.green else color.red);
SMA9.AssignValueColor(if ft > SMA9[1] then color.green else color.red);
SMA10.AssignValueColor(if ft > SMA10[1] then color.green else color.red);
SMA11.AssignValueColor(if ft > SMA11[1] then color.green else color.red);
SMA12.AssignValueColor(if ft > SMA12[1] then color.green else color.red);
SMA13.AssignValueColor(if ft > SMA13[1] then color.green else color.red);

#ARROWS
plot ArrowDown = if arrows == 0 and (Ft Crosses below FTOneBarBack) then FT else
if arrows == 1 and (Ft Crosses below SMA[1]) then FT else
if arrows == 2 and (Ft Crosses below SMA1[1]) then FT else
if arrows == 3 and (Ft Crosses below SMA2[1]) then FT else
if arrows == 4 and (Ft Crosses below SMA3[1]) then FT else
if arrows == 5 and (Ft Crosses below SMA4[1]) then FT else
if arrows == 6 and (Ft Crosses below SMA5[1]) then FT else
if arrows == 7 and (Ft Crosses below SMA6[1]) then FT else
if arrows == 8 and (Ft Crosses below SMA7[1]) then FT else
if arrows == 9 and (Ft Crosses below SMA8[1]) then FT else
if arrows == 10 and (Ft Crosses below SMA9[1]) then FT else
if arrows == 11 and (Ft Crosses below SMA10[1]) then FT else
if arrows == 12 and (Ft Crosses below SMA11[1]) then FT else
if arrows == 13 and (Ft Crosses below SMA12[1]) then FT else
if arrows == 14 and (Ft Crosses below SMA13[1]) then FT else double.nan;
ArrowDown.setpaintingStrategy(paintingStrategy.Arrow_Down);
ArrowDown.setDefaultColor(color.Magenta);
ArrowDown.setLineWeight(dotsize);

plot ArrowUp = if arrows == 0 and (FT crosses above FTOneBarBack ) then FT else
if arrows == 1 and (FT crosses above SMA[1]) then FT else
if arrows == 2 and (FT crosses above SMA1[1]) then FT else
if arrows == 3 and (FT crosses above SMA2[1]) then FT else
if arrows == 4 and (FT crosses above SMA3[1]) then FT else
if arrows == 5 and (FT crosses above SMA4[1]) then FT else
if arrows == 6 and (FT crosses above SMA5[1]) then FT else
if arrows == 7 and (FT crosses above SMA6[1]) then FT else
if arrows == 8 and (FT crosses above SMA7[1]) then FT else
if arrows == 9 and (FT crosses above SMA8[1]) then FT else
if arrows == 10 and (FT crosses above SMA9[1]) then FT else
if arrows == 11 and (FT crosses above SMA10[1]) then FT else
if arrows == 12 and (FT crosses above SMA11[1]) then FT else
if arrows == 13 and (FT crosses above SMA12[1]) then FT else
if arrows == 14 and (FT crosses above SMA13[1]) then FT else double.nan;
ArrowUp.setpaintingStrategy(paintingStrategy.Arrow_Up);
ArrowUp.setDefaultColor(color.Cyan);
ArrowUp.setLineWeight(dotsize);

AssignPriceColor( if paintbars == 0 and FT > FTOneBarBack then Color.Green else if paintbars == 0 and FT < FTOneBarBack then Color.Red else if paintbars == 1 and FT > SMA[1] then Color.Green else if paintbars == 1 and FT < SMA[1] then Color.Red else if paintbars == 2 and FT > SMA1[1] then Color.Green else if paintbars == 2 and FT < SMA1[1] then Color.Red else if paintbars == 3 and FT > SMA2[1] then Color.Green else if paintbars == 3 and FT < SMA2[1] then Color.Red else if paintbars == 4 and FT > SMA3[1] then Color.Green else if paintbars == 4 and FT < SMA3[1] then Color.Red else if paintbars == 5 and FT > SMA4[1] then Color.Green else if paintbars == 5 and FT < SMA4[1] then Color.Red else if paintbars == 6 and FT > SMA5[1] then Color.Green else if paintbars == 6 and FT < SMA5[1] then Color.Red else if paintbars == 7 and FT > SMA6[1] then Color.Green else if paintbars == 7 and FT < SMA6[1] then Color.Red else if paintbars == 8 and FT > SMA7[1] then Color.Green else if paintbars == 8 and FT < SMA7[1] then Color.Red else if paintbars == 9 and FT > SMA8[1] then Color.Green else if paintbars == 9 and FT < SMA8[1] then Color.Red else if paintbars == 10 and FT > SMA9[1] then Color.Green else if paintbars == 10 and FT < SMA9[1] then Color.Red else if paintbars == 11 and FT > SMA10[1] then Color.Green else if paintbars == 11 and FT < SMA10[1] then Color.Red else if paintbars == 12 and FT > SMA11[1] then Color.Green else if paintbars == 12 and FT < SMA11[1] then Color.Red else if paintbars == 13 and FT > SMA12[1] then Color.Green else if paintbars == 13 and FT < SMA12[1] then Color.Red else if paintbars == 14 and FT > SMA13[1] then Color.Green else if paintbars == 14 and FT < SMA13[1] then Color.Red else color.current);

AddLabel(Show_labels,"SMA:" + SMA,if ft > SMA[1] then color.green else color.red);
AddLabel(Show_labels,"1MA:" + SMA1,if ft > SMA1[1] then color.green else color.red);
AddLabel(Show_labels,"2MA:" + SMA2,if ft > SMA2[1] then color.green else color.red);
AddLabel(Show_labels,"3MA:" + SMA3,if ft > SMA3[1] then color.green else color.red);
AddLabel(Show_labels,"4MA:" + SMA4,if ft > SMA4[1] then color.green else color.red);
AddLabel(Show_labels,"5MA:" + SMA5,if ft > SMA5[1] then color.green else color.red);
AddLabel(Show_labels,"6MA:" + SMA6,if ft > SMA6[1] then color.green else color.red);
AddLabel(Show_labels,"7MA:" + SMA7,if ft > SMA7[1] then color.green else color.red);
AddLabel(Show_labels,"8MA:" + SMA8,if ft > SMA8[1] then color.green else color.red);
AddLabel(Show_labels,"9MA:" + SMA9,if ft > SMA9[1] then color.green else color.red);
AddLabel(Show_labels,"10MA:" + SMA10,if ft > SMA10[1] then color.green else color.red);
AddLabel(Show_labels,"11MA:" + SMA11,if ft > SMA11[1] then color.green else color.red);
AddLabel(Show_labels,"12MA:" + SMA12,if ft > SMA12[1] then color.green else color.red);
AddLabel(Show_labels,"13MA:" + SMA13,if ft > SMA13[1] then color.green else color.red);
 

Join useThinkScript to post your question to a community of 21,000+ developers and traders.

Similar threads

Not the exact question you're looking for?

Start a new thread and receive assistance from our community.

87k+ Posts
295 Online
Create Post

Similar threads

Similar threads

The Market Trading Game Changer

Join 2,500+ subscribers inside the useThinkScript VIP Membership Club
  • Exclusive indicators
  • Proven strategies & setups
  • Private Discord community
  • ‘Buy The Dip’ signal alerts
  • Exclusive members-only content
  • Add-ons and resources
  • 1 full year of unlimited support

Frequently Asked Questions

What is useThinkScript?

useThinkScript is the #1 community of stock market investors using indicators and other tools to power their trading strategies. Traders of all skill levels use our forums to learn about scripting and indicators, help each other, and discover new ways to gain an edge in the markets.

How do I get started?

We get it. Our forum can be intimidating, if not overwhelming. With thousands of topics, tens of thousands of posts, our community has created an incredibly deep knowledge base for stock traders. No one can ever exhaust every resource provided on our site.

If you are new, or just looking for guidance, here are some helpful links to get you started.

What are the benefits of VIP Membership?
VIP members get exclusive access to these proven and tested premium indicators: Buy the Dip, Advanced Market Moves 2.0, Take Profit, and Volatility Trading Range. In addition, VIP members get access to over 50 VIP-only custom indicators, add-ons, and strategies, private VIP-only forums, private Discord channel to discuss trades and strategies in real-time, customer support, trade alerts, and much more. Learn all about VIP membership here.
How can I access the premium indicators?
To access the premium indicators, which are plug and play ready, sign up for VIP membership here.
Back
Top