Multi-timeframe (MTF) Moving Average Indicator for ThinkorSwim

BenTen

Administrative
Staff member
Staff
VIP
Lifetime
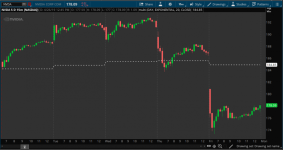
If you want to display moving averages from higher timeframe such as the hourly or daily on your lower timeframe chart, this indicator will help you do that. It basically displays higher timeframe moving averages on your 5m, 15m, or 30m chart. Anything with a higher timeframe moving average will work.

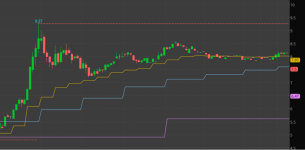
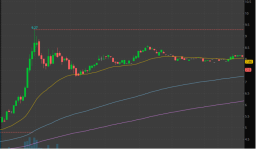
Here I have the 20 Daily Exponential Moving Average on my 15 minute chart.

iyf4H3R.png


You have the option between EMA, SMA (simple moving average), Hull, Weighted, and Wilders.

thinkScript Code

Rich (BB code):
# MTF Moving Average

input Period = aggregationPeriod.HOUR;
input AvgType = averageType.SIMPLE;
input Length = 50;
input priceclose = close;

plot AVG = MovingAverage(AvgType, close(period = Period), Length);
AVG.setdefaultcolor(color.yellow);

Shareable Link

https://tos.mx/5BpIqL

I'm unable to locate the original developer of this indicator. If you know who made this, please let me know.

Video Tutorial


Attachments

  • iyf4H3R.png
    iyf4H3R.png
    163.7 KB · Views: 221
Last edited:

Join useThinkScript to post your question to a community of 21,000+ developers and traders.

Hi Ben and All,

I took the MTF moving average indicator above and wanted to do a scan for multi-time frames price above or below 50 EMAs. TOS is not letting me use the code as you created above. It is complaining that secondary aggregation period is not allowed if I use e.g plot pos_trend = BULLISH_TREND;.

If I just use another plot row just price, included in code below plot c = c2; it won't complain about secondary aggregation. There is no issue, if I use this code to plot on a chart. It is only complaining when I use it in stock hacker to scan.
 
Last edited:
@Rocky My understanding is that secondary aggs are not allowed in the scanner when put in as code like you have.
There's a second way to create a scan that may work out. Please watch the 2 short videos in the Tutorial Section called How to Drive the Scanner. You might be better using the "wizard". I won't know until later tonight or Sunday.

By the way, that's pretty decent looking code but I think something is missing. I won't know until i can put in the editor. Markos
 
Many Thanks for the feedback Markos and horserider, I'll check the videos you mentioned and SMA study in TOS again. TOS has many glitches in the scan process itself, it doesn't show all stocks meeting the criteria, almost every single day, sometimes even if I will just put price and volume as filters. I can make three separate study filters for the above and use in scanning, from my experience it is better to have all studies in one code rather than three separate codes. That's why this code. Otherwise, TOS will start skipping stocks in scan.

Horserider, I used to work with SMAs. After spending couple of months with SMAs, I decided to switch to EMAs for all averages. I need earlier confirmations in trend reversal even for bigger averages like 50, 100 & 200. You never know I may come back to SMAs, it's a vicious circle you know, LOL.

Have a great day guys!
@Rocky What are the other criteria? Price? Size?
I think if your intention is to scan in the S&P500 or Russel1000, you would have to write a custom code that looks different than than you already coded.
After having reviewed the videos and read a little, hopefully you'll come up with the answer.
 
Last edited:
This bothered me so I wrote a 15 min, 1 hour, and 1 Day scan over 50 EMA. I did it custom until I realized it is Built In.
Give this a try...
av0zJKS.png
 

Attachments

  • av0zJKS.png
    av0zJKS.png
    100.2 KB · Views: 206
@Piper2808t please think thru all of the things you would like, so we have all of the puzzle pieces.

1. How do you envision a 200Dema hepling with a swing trade?
2. What are you already using?
3. What would you like to see different?

If you want it in a watchlist column, that's the 4th entry from the top when you use the little gear to the right of the header. It's already customized to give you green when above and default red when below the EMA, That you can do on your own, right?
 
@Rocky What are the other criteria? Price? Size?
I think if your intention is to scan in the S&P500 or Russel1000, you would have to write a custom code that looks different than than you already coded.
After having reviewed the videos and read a little, hopefully you'll come up with the answer.
Hello Markos,

Thanks for the quick follow up Markos. I'm on vacation so I would like to apologize for the delayed follow-up. I only want to use price (0.1 to 20$) and min volume (200k) as my default filters and scan all available stocks. This way I'll be able to use it for both day and swing trading penny and close to penny stocks. Then price above or below 50 EMA on 1 week, 1 day, 1 hr and possibly 15min but not mandatory.

I don't want to bombard TOS with tonns of conditions, it will fail to give all stocks I'm well familiar with that.

Regards,
Rocky
 
Last edited:
This bothered me so I wrote a 15 min, 1 hour, and 1 Day scan over 50 EMA. I did it custom until I realized it is Built In.
Give this a try...
av0zJKS.png

Hello Markos,

If I'll use scanning this way, all three conditions have to be met and then only stocks meeting all three criterion's will be displayed.

I'm keen on viewing all stocks fitting price and volume (0.1 to 20$ and 200k min volume) as minimum and then have respective columns for all showing what price is doing wrt 50EMA.

Will later use percent change to sort or volume to sort. I play both LONGs and SHORTs, so I can note down stock for watch later down the line or on daily watch, depending on chart and price action.

Regards,
Rocky
 

Attachments

  • av0zJKS.png
    av0zJKS.png
    100.2 KB · Views: 142
Markos et al,

Aim is to use least number of criterion's (so as not to confuse TOS) and weekly analyze maybe 50-100 stocks for the coming week/month from the watchlist.

I've experienced tos dropping stocks even with just a min percentage filter +ve and -ve. So, I want to use least filters and rest just display on chart or watchlist in columns.

Regards,
Rocky
 
Can someone please add a feature to the MTF moving average when the average changes direction it changes color, like up blue and down red ? Thanks
 
hello, MTF is great but can you make it to look like this"

kWRdUD5.png


i'm a pattern trader, and is hard for me to see what pattern is in the chart with the MTF
now it looks like this

1jce42A.png


i want it to look like this

kWRdUD5.png
 

Attachments

  • kWRdUD5.png
    kWRdUD5.png
    68.1 KB · Views: 147
  • 1jce42A.png
    1jce42A.png
    42 KB · Views: 171
  • kWRdUD5.png
    kWRdUD5.png
    68.1 KB · Views: 150
Last edited by a moderator:

Similar threads

Not the exact question you're looking for?

Start a new thread and receive assistance from our community.

87k+ Posts
564 Online
Create Post

Similar threads

Similar threads

The Market Trading Game Changer

Join 2,500+ subscribers inside the useThinkScript VIP Membership Club
  • Exclusive indicators
  • Proven strategies & setups
  • Private Discord community
  • ‘Buy The Dip’ signal alerts
  • Exclusive members-only content
  • Add-ons and resources
  • 1 full year of unlimited support

Frequently Asked Questions

What is useThinkScript?

useThinkScript is the #1 community of stock market investors using indicators and other tools to power their trading strategies. Traders of all skill levels use our forums to learn about scripting and indicators, help each other, and discover new ways to gain an edge in the markets.

How do I get started?

We get it. Our forum can be intimidating, if not overwhelming. With thousands of topics, tens of thousands of posts, our community has created an incredibly deep knowledge base for stock traders. No one can ever exhaust every resource provided on our site.

If you are new, or just looking for guidance, here are some helpful links to get you started.

What are the benefits of VIP Membership?
VIP members get exclusive access to these proven and tested premium indicators: Buy the Dip, Advanced Market Moves 2.0, Take Profit, and Volatility Trading Range. In addition, VIP members get access to over 50 VIP-only custom indicators, add-ons, and strategies, private VIP-only forums, private Discord channel to discuss trades and strategies in real-time, customer support, trade alerts, and much more. Learn all about VIP membership here.
How can I access the premium indicators?
To access the premium indicators, which are plug and play ready, sign up for VIP membership here.
Back
Top