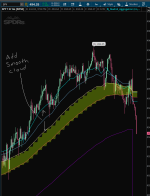
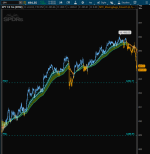
@MerryDay @SleepyZ Thank you both for the response, I didn't realize the smoothed lines could not be used as a reference. Much appreciated, in the same veign just to clarify from the current thread and this one
https://usethinkscript.com/threads/aggregationperiod-variable.10625/ (I've read both repeatedly) there is also no way for TOS to recognize the chart time frame you are currently on to reference in a formula correct? i.e. can't define current time frame as an aggregation to utilize in a formula? Thanks again for the prompt response. Below is my attempted solution to this issue. For anyone users of script below please read instructions on the top of code before utilizing.
# MTF Moving Average Crossover With Arrows, Alerts, Crossing Count and Bubble at Cross
# Mobius
# Chat Room Request 01.25.2017
# Modified a bit by BenTen
# 02/03/2024 Modified further by GoLo to plot higher aggregation moving averages on lower chart timeframes. Please read instructions below:
# Logic is simple math to take the moving average (ma) you prefer displayed on the time frame you desire(target aggregation) on any chart timeframe lower than the desired time frame (chart aggregation).
# For example assuming we want a 10 moving average from a 5min aggregation (target aggregation) to plot on the current 2 min chart (chart aggregation) the formula would be (without coding): plot movingAverage length * (target aggregation / chart aggregation) or illustrated in numbers: = 10 * (5/2) = 25 where 25 would be the movingaverage length you'd want to see plotted which approximates the 10 ma on a 5 min timeframe when you are currently on a 2 min chart. Ideally would like the chart aggregation to automatically pull from your current chart so you'd only need to select the moving average you desire and the timeframe you'd like to see that moving average. However, my understanding is that it is not possible to utilize the current aggregation as a reference in any formulas. If somebody knows how to do this please feel free to upgrade code.
# To utilize simply select your current timeframe you'd like to view (must match your current chart) and then select the timeframe you'd prefer the moving average to plot upon (both in minutes).
#Last select the actual moving average lengths you prefer and/or type i.e. simple,exponential, etc.
# Added bar coloring options similar to Bjorgum Triple EMA coloring scheme
# Cloud colors and other colors are adjustable under Globals at bottom
# Credit for various ideas go to Bjorgum Triple EMA (paint bars) and Saty Mahajan (multicolored ribbon).
DefineGlobalColor( "Bull Lines", CreateColor(0, 204, 204));
DefineGlobalColor( "Bear Lines", Color.LIGHT_ORANGE);
# --------------------------------------------------- Set aggregation conversion --------------------------------
input chart_timeframe_min = 1;
input target_aggregation_min = 2;
;
# --------------------------------------------------- Add 5 Scalp EMA -----------------------------------------------
input ScalpEMA = 5;
input averageTypeS = AverageType.EXPONENTIAL;
def priceS = close;
#DefineGlobalColor( "Fast EMA+", CreateColor(0, 204, 204));
#DefineGlobalColor( "Fast EMA-", color.light_orange);
plot Scalp_EMA = MovingAverage(averageTypeS, priceS, ScalpEMA * target_aggregation_min / chart_timeframe_min);
Scalp_EMA.SetStyle(Curve.SHORT_DASH);
Scalp_EMA.AssignValueColor(if Scalp_EMA >= Scalp_EMA[1] then GlobalColor("Bull Lines") else GlobalColor("Bear Lines"));
# -------------------------------------------- EMA 1 -----------------------------------------
input EMA1 = 10;
input averageType = AverageType.EXPONENTIAL;
def price = close;
#DefineGlobalColor( "Fast EMA+", CreateColor(0, 204, 204));
#DefineGlobalColor( "Fast EMA-", color.light_orange);
plot EMA_1 = MovingAverage(averageType, price, EMA1 * target_aggregation_min / chart_timeframe_min);
EMA_1.SetStyle(Curve.SHORT_DASH);
EMA_1.AssignValueColor(if EMA_1 >= EMA_1[1] then GlobalColor("Bull Lines") else GlobalColor("Bear Lines"));
#EMA_1.SetDefaultColor(GetColor(9));
# -------------------------------------------- EMA 2 -----------------------------------------
input EMA2 = 17;
input averageType2 = AverageType.EXPONENTIAL;
def price2 = close;
#DefineGlobalColor( "Slow EMA+", CreateColor(0, 204, 204));
#DefineGlobalColor( "Slow EMA-", color.light_orange);
plot EMA_2 = MovingAverage(averageType2, price2, EMA2 * target_aggregation_min / chart_timeframe_min);
EMA_2.SetStyle(Curve.SHORT_DASH);
EMA_2.AssignValueColor(if EMA_2 >= EMA_2[1] then GlobalColor("Bull Lines") else GlobalColor("Bear Lines"));
#EMA_2.SetDefaultColor(GetColor(12));
# -------------------------------------------- EMA 3 -----------------------------------------
input EMA3 = 25;
input averageType3 = AverageType.EXPONENTIAL;
def price3 = close;
#DefineGlobalColor( "EMA3+", CreateColor(0, 204, 204));
#DefineGlobalColor( "EMA3-", color.light_orange);
plot EMA_3 = MovingAverage(averageType3, price3, EMA3 * target_aggregation_min / chart_timeframe_min);
EMA_3.AssignValueColor(if EMA_3 >= EMA_3[1] then GlobalColor("Bull Lines") else GlobalColor("Bear Lines"));
#EMA_3.SetDefaultColor(GetColor(5));
# --------------------------------------------------- Add Cloud -----------------------------------------------
DefineGlobalColor( "Bullish Fast Cloud", CreateColor(0, 204, 204));
DefineGlobalColor( "Bearish Fast Cloud", Color.LIGHT_ORANGE);
input ShowScalpCloud = no;
#DefineGlobalColor( "Bullish Scalp Cloud", CreateColor(0, 204, 204));
#DefineGlobalColor( "Bearish Scalp Cloud", color.light_orange);
AddCloud(if ShowScalpCloud then Scalp_EMA else Double.NaN, EMA_1, GlobalColor("Bullish Fast Cloud"), GlobalColor("Bearish Fast Cloud"));
input ShowfastCloud = yes;
DefineGlobalColor( "Bullish Fast Cloud", CreateColor(0, 204, 204));
DefineGlobalColor( "Bearish Fast Cloud", Color.LIGHT_ORANGE);
AddCloud(if ShowfastCloud then EMA_1 else Double.NaN, EMA_2, GlobalColor("Bullish Fast Cloud"), GlobalColor("Bearish Fast Cloud"));
input ShowSlowCloud = yes;
DefineGlobalColor( "Bullish Slow Cloud", Color.LIME);
DefineGlobalColor( "Bearish Slow Cloud", Color.YELLOW);
AddCloud(if ShowSlowCloud then EMA_2 else Double.NaN, EMA_3, GlobalColor("Bullish Slow Cloud"), GlobalColor("Bearish Slow Cloud"));
# --------------------------------------- EMA Cross Signal ----------------------------------------
input showEMACross = no;
plot CrossUp = if EMA_1 crosses above EMA_2 then EMA_2 else Double.NaN;
plot CrossDown = if EMA_1 crosses below EMA_2 then EMA_2 else Double.NaN;
CrossUp.SetHiding(!showEMACross);
CrossDown.SetHiding(!showEMACross);
CrossUp.SetDefaultColor(Color.WHITE);
CrossUp.SetPaintingStrategy(PaintingStrategy.ARROW_UP);
CrossDown.SetDefaultColor(Color.WHITE);
CrossDown.SetPaintingStrategy(PaintingStrategy.ARROW_DOWN);
# =========================== Add PB Cloud Option =======================================
input EMApb = 13;
input averageTypepb = AverageType.EXPONENTIAL;
def pricepb = close;
DefineGlobalColor( "EMApb+", GetColor (8));
DefineGlobalColor( "EMA4-", GetColor (8));
plot EMA_pb = MovingAverage(averageTypepb, pricepb, EMApb * target_aggregation_min / chart_timeframe_min);
EMA_pb.AssignValueColor(if EMA_pb >= EMA_pb[1] then GlobalColor("EMApb+") else GlobalColor("EMApb-"));
input PBCloud = Yes;
DefineGlobalColor( "EMAPB+", CreateColor(201, 255, 234));
DefineGlobalColor( "EMAPB-", CreateColor(255, 105, 105));
input EMAPBfast = 12;
input EMAPBslow = 14;
def EMA_PBFast = if PBCloud then ExpAverage(close, EMAPBfast * target_aggregation_min / chart_timeframe_min) else Double.NaN;
def EMA_PBSlow = if PBCloud then ExpAverage(close, EMAPBslow * target_aggregation_min / chart_timeframe_min) else Double.NaN;
AddCloud( EMA_PBFast, EMA_PBSlow, GlobalColor("EMAPB+"), GlobalColor("EMAPB-"));
# ---------------------------------------------------- PB Alerts ----------------------------------
def UpSignal = price crosses below EMA_PBFast and EMA_1 > EMA_2;
def DownSignal = price crosses above EMA_PBFast and EMA_1 < EMA_2;
#UpSignal.SetDefaultColor(Color.UPTICK);
#UpSignal.SetPaintingStrategy(PaintingStrategy.BOOLEAN_ARROW_UP);
#DownSignal.SetDefaultColor(Color.DOWNTICK);
#DownSignal.SetPaintingStrategy(PaintingStrategy.BOOLEAN_ARROW_DOWN);
# Alerts
Alert(UpSignal, "PB Bullish", Alert.BAR, Sound.Ding);
Alert(DownSignal, "PB Bearish", Alert.BAR, Sound.Bell);
# -------------------------------------------- Paint Bars Scalp ----------------------------------
DefineGlobalColor( "Bull Candle", CreateColor(100, 181, 246));
DefineGlobalColor( "Bear Candle", color.LIGHT_ORANGE);
DefineGlobalColor( "Neutral Candle", color.LIGHT_GRAY);
input paintbars_scalp = no;
AssignPriceColor(
if paintbars_scalp and close > scalp_EMA and close > EMA_1 then GlobalColor("Bull Candle")
else if paintbars_scalp and close < scalp_EMA and close < EMA_1 then GlobalColor("Bear Candle")
else if paintbars_scalp then GlobalColor("Neutral Candle")
else Color.CURRENT
);
# -------------------------------------------- Paint Bars ----------------------------------
input paintbars = no;
AssignPriceColor(
if paintbars and close > EMA_1 and close > EMA_2 then GlobalColor("Bull Candle")
else if paintbars and close < EMA_1 and close < EMA_2 then GlobalColor("Bear Candle")
else if paintbars then GlobalColor("Neutral Candle")
else Color.CURRENT
);


