Multi-timeframe (MTF) Moving Average Indicator for ThinkorSwim

@horserider is there a way to color the bars on the smaller time frame as they cross above and below the mtf moving avg ? thank you
Add this to the bottom of your script:
Ruby:
 input paintCandles = yes ;
AssignPriceColor(if !paintCandles then color.current else
    if close crosses above AVG then color.cyan else
        if close crosses below AVG then color.magenta else color.current);
 
Last edited:
This should work for ya (y)

Code:
########################   MULTIPLE TIMEFRAMES   ########################
script MTF {

input timeframe = aggregationPeriod.day;
def priceH = high(period = timeframe);
def priceL = low(period = timeframe);
plot priceC = close(period = timeframe);

input length = 10;

plot sma50 = simpleMovingAvg(pricec, length = 50);
plot sma200 = simpleMovingAvg(pricec, length = 200);
}

input Timeframe = aggregationPeriod.DAY;
input Timeframe2 = aggregationPeriod.WEEK;

plot W_Mid = MTF(length = 50, timeframe = Timeframe).sma50;
plot W_Long = MTF(length = 200, timeframe = Timeframe).sma200;


W_Mid.AssignValueColor(color.gray);
W_Long.AssignValueColor(color.gray);

W_Mid.SetLineWeight(2);
W_Long.SetLineWeight(3);

plot D_Mid = MTF(length = 50, timeframe = Timeframe2).sma50;
plot D_Long = MTF(length = 200, timeframe = Timeframe2).sma200;

D_Mid.AssignValueColor(color.white);
D_Long.AssignValueColor(color.white);

D_Mid.SetLineWeight(2);
D_Long.SetLineWeight(3);
 
Code:
# TS_DoubleMA
# [URL]http://www.thinkscripter.com[/URL]
# [EMAIL][email protected][/EMAIL]
# Last Update 08 Dec 2010

input displace = 0;
input MA1_length = 7;
input MA2_length = 20;
input price = close;

DefineGlobalColor("RisingMA", color.green);
DefineGlobalColor("FallingMA", color.red);

input movingAverageType1 = {default Simple, Exponential, Weighted, Hull, Variable};
input movingAverageType2 = {default Variable, Simple, Exponential, Weighted, Hull};

def data1;

switch (movingAverageType1) {
case Simple:
    data1 = compoundValue(1, Average(price[-displace], MA1_length), price);
case Exponential:
    data1 = compoundValue(1, ExpAverage(price[-displace], MA1_length), price);
case Weighted:
    data1 = compoundValue(1, wma(price[-displace], MA1_length), price);
Case Hull:
    data1 = compoundValue(1, hullMovingAvg(price[-displace], MA1_length), price);
case variable:
    data1 = compoundValue(1, VariableMA(price = price, length = MA1_length), price);
}

plot DoubleMA;

switch (movingAverageType2) {
case Simple:
    DoubleMA = compoundValue(1, Average(data1[-displace], MA2_length), data1);
case Exponential:
    DoubleMA = compoundValue(1, ExpAverage(data1[-displace], MA2_length), data1);
case Weighted:
    DoubleMA = compoundValue(1, wma(data1[-displace], MA2_length), data1);
Case Hull:
    DoubleMA = compoundValue(1, hullMovingAvg(data1[-displace], MA2_length), data1);
case variable:
    DoubleMA = compoundValue(1, VariableMA( data1, MA2_length), data1);
}

DoubleMA.SetLineWeight(4);
DoubleMA.AssignValueColor(if DoubleMA > DoubleMA[1] then globalColor("RisingMA") else globalColor("FallingMA"));
DoubleMA.HideBubble();
 
Last edited by a moderator:
@RDX17

Code:
input price = close;
input length = 12;
input Period = aggregationPeriod.THREE_MIN;
input Period2 = AggregationPeriod.FIVE_MIN;
input Period3 = AggregationPeriod.FIFTEEN_MIN;

def halflength = Ceil(length / 2);
def sqrtlength = Ceil(Sqrt(length));

def val = 2 * ExpAverage(close(period = Period), halflength) - ExpAverage(close(period = Period), sqrtlength);
plot EHMA = ExpAverage(val, sqrtlength);
ehma.setdefaultcolor(color.yellow);

def val2 = 2 * ExpAverage(close(period = Period2), halflength) - ExpAverage(close(period = Period2), sqrtlength);
plot EHMA2 = ExpAverage(val2, sqrtlength);

def val3 = 2 * ExpAverage(close(period = Period3), halflength) - ExpAverage(close(period = Period3), sqrtlength);
plot EHMA3 = ExpAverage(val3, sqrtlength);
ehma3.setdefaultcolor(color.PLUM);
@horserider so how would I code this if I wanted to use this for input lengths 20, 50, 100, and 200 SMA on timeframes 20 minutes 30, 1hour, 2 hour and daily?

Higher Time frame moving average
once you add the code you can configure it to use whatever unit of time you want, the default is DAY
NOTE: The study time frame (aggregationPeriod) must be equal to or larger than the "charted" time frame
Code:
input time = aggregationPeriod.DAY;
input type = averageType.EXPONENTIAL;
input length = 9;
plot average = MovingAverage(averageType = Type, data = close(period = time), length = length);
@XeoNoX can this code have multiple inputs on the length. Wondering if I add a semicolon would it work. Guess I could just try it 😅 
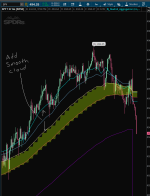
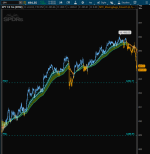
trying to figure out a way to get away from the original code in the post having the lines not as smooth so I'm just trying every version posted to see if I can get the results

This should work for ya (y)

Code:
########################   MULTIPLE TIMEFRAMES   ########################
script MTF {

input timeframe = aggregationPeriod.day;
def priceH = high(period = timeframe);
def priceL = low(period = timeframe);
plot priceC = close(period = timeframe);

input length = 10;

plot sma50 = simpleMovingAvg(pricec, length = 50);
plot sma200 = simpleMovingAvg(pricec, length = 200);
}

input Timeframe = aggregationPeriod.DAY;
input Timeframe2 = aggregationPeriod.WEEK;

plot W_Mid = MTF(length = 50, timeframe = Timeframe).sma50;
plot W_Long = MTF(length = 200, timeframe = Timeframe).sma200;


W_Mid.AssignValueColor(color.gray);
W_Long.AssignValueColor(color.gray);

W_Mid.SetLineWeight(2);
W_Long.SetLineWeight(3);

plot D_Mid = MTF(length = 50, timeframe = Timeframe2).sma50;
plot D_Long = MTF(length = 200, timeframe = Timeframe2).sma200;

D_Mid.AssignValueColor(color.white);
D_Long.AssignValueColor(color.white);

D_Mid.SetLineWeight(2);
D_Long.SetLineWeight(3);
@maverickmitch if I wanted to add the 20 and 100 sma as well how would those changes be displayed
 
Code:
# TS_DoubleMA
# [URL]http://www.thinkscripter.com[/URL]
# [EMAIL][email protected][/EMAIL]
# Last Update 08 Dec 2010

input displace = 0;
input MA1_length = 7;
input MA2_length = 20;
input price = close;

DefineGlobalColor("RisingMA", color.green);
DefineGlobalColor("FallingMA", color.red);

input movingAverageType1 = {default Simple, Exponential, Weighted, Hull, Variable};
input movingAverageType2 = {default Variable, Simple, Exponential, Weighted, Hull};

def data1;

switch (movingAverageType1) {
case Simple:
    data1 = compoundValue(1, Average(price[-displace], MA1_length), price);
case Exponential:
    data1 = compoundValue(1, ExpAverage(price[-displace], MA1_length), price);
case Weighted:
    data1 = compoundValue(1, wma(price[-displace], MA1_length), price);
Case Hull:
    data1 = compoundValue(1, hullMovingAvg(price[-displace], MA1_length), price);
case variable:
    data1 = compoundValue(1, VariableMA(price = price, length = MA1_length), price);
}

plot DoubleMA;

switch (movingAverageType2) {
case Simple:
    DoubleMA = compoundValue(1, Average(data1[-displace], MA2_length), data1);
case Exponential:
    DoubleMA = compoundValue(1, ExpAverage(data1[-displace], MA2_length), data1);
case Weighted:
    DoubleMA = compoundValue(1, wma(data1[-displace], MA2_length), data1);
Case Hull:
    DoubleMA = compoundValue(1, hullMovingAvg(data1[-displace], MA2_length), data1);
case variable:
    DoubleMA = compoundValue(1, VariableMA( data1, MA2_length), data1);
}

DoubleMA.SetLineWeight(4);
DoubleMA.AssignValueColor(if DoubleMA > DoubleMA[1] then globalColor("RisingMA") else globalColor("FallingMA"));
DoubleMA.HideBubble();

To create an MTF, change:
def price = close ;

To this:
input agg = AggregationPeriod.HOUR;
def price = close(period = agg);

Here is the complete code for MTF TS_DoubleMA
Ruby:
# TS_DoubleMA
# [URL]http://www.thinkscripter.com[/URL]
# [EMAIL][email protected][/EMAIL]
# Last Update 08 Dec 2010

input displace = 0;
input MA1_length = 7;
input MA2_length = 20;
input agg = AggregationPeriod.HOUR;
def price = close(period = agg);

DefineGlobalColor("RisingMA", color.green);
DefineGlobalColor("FallingMA", color.red);

input movingAverageType1 = {default Simple, Exponential, Weighted, Hull, Variable};
input movingAverageType2 = {default Variable, Simple, Exponential, Weighted, Hull};

def data1;

switch (movingAverageType1) {
case Simple:
    data1 = compoundValue(1, Average(price[-displace], MA1_length), price);
case Exponential:
    data1 = compoundValue(1, ExpAverage(price[-displace], MA1_length), price);
case Weighted:
    data1 = compoundValue(1, wma(price[-displace], MA1_length), price);
Case Hull:
    data1 = compoundValue(1, hullMovingAvg(price[-displace], MA1_length), price);
case variable:
    data1 = compoundValue(1, VariableMA(price = price, length = MA1_length), price);
}

plot DoubleMA;

switch (movingAverageType2) {
case Simple:
    DoubleMA = compoundValue(1, Average(data1[-displace], MA2_length), data1);
case Exponential:
    DoubleMA = compoundValue(1, ExpAverage(data1[-displace], MA2_length), data1);
case Weighted:
    DoubleMA = compoundValue(1, wma(data1[-displace], MA2_length), data1);
Case Hull:
    DoubleMA = compoundValue(1, hullMovingAvg(data1[-displace], MA2_length), data1);
case variable:
    DoubleMA = compoundValue(1, VariableMA( data1, MA2_length), data1);
}

DoubleMA.SetLineWeight(4);
DoubleMA.AssignValueColor(if DoubleMA > DoubleMA[1] then globalColor("RisingMA") else globalColor("FallingMA"));
 
See if this helps. It is using TOS 'enableapproximation()' function to smooth the lines of the fast and slow multi-timeframe averages on the following chart. You can choose whether to display the unsmoothed or smoothed or both methods for comparison purposes. The chart below shows both methods.
For this MTF code, I've added more moving averages or "ribbon" to it. However, trying to get a cloud to plot on the smooth averages and not sure what I have wrong. The fast cloud code will not print on "smoothed lines", by comparison I'm showing the slow cloud code plots correctly but it's "jagged" based on the original plot. Any help is appreciated as I'd like to set both clouds to post on the smooth plot. Thanks, modified code below:

#Example Smooth Plot HigherAgg on LowerAgg
#Usethinkscript request
#Sleepyz

input show_original_plot = yes;
input show_smooth_plot = yes;

input aggperiod = AggregationPeriod.TWO_MIN;
input scalpema = 5;
input ema1 = 10;
input ema2 = 17;
input ema3 = 25;
input ema4 = 48;
input price = FundamentalType.CLOSE;
input averageType = AverageType.EXPONENTIAL;

plot scalp_ema = MovingAverage(averageType, Fundamental(price, period = aggperiod), scalpema);
scalp_ema.SetHiding(show_original_plot == no);

plot Ema_1 = MovingAverage(averageType, Fundamental(price, period = aggperiod), ema1);
Ema_1.SetHiding(show_original_plot == no);

plot Ema_2 = MovingAverage(averageType, Fundamental(price, period = aggperiod), ema2);
Ema_2.SetHiding(show_original_plot == no);

plot Ema_3 = MovingAverage(averageType, Fundamental(price, period = aggperiod), ema3);
Ema_3.SetHiding(show_original_plot == no);

plot Ema_4 = MovingAverage(averageType, Fundamental(price, period = aggperiod), ema4);
Ema_4.SetHiding(show_original_plot == no);


#Smoothed Plots
def minutes = aggperiod / 60000;
def bar = BarNumber();
def x = if bar == 1 or bar[1] % ((Ceil(minutes) ) / (GetAggregationPeriod() / 60000)) == 0
then scalp_ema
else x[1];

def xx = (if x != x[1] then xx[1] + 1 else xx[1]);
def xxx = if xx != xx[1] then x else Double.NaN;
plot xsmooth = if !show_smooth_plot then Double.NaN else if IsNaN(close[-1]) then scalp_ema else xxx;
xsmooth.EnableApproximation();

def x1 = if bar == 1 or bar[1] % ((Ceil(minutes) ) / (GetAggregationPeriod() / 60000)) == 0
then Ema_1
else x1[1];

def xx1 = (if x1 != x1[1] then xx1[1] + 1 else xx[1]);
def xxx1 = if xx1 != xx1[1] then x1 else Double.NaN;
plot x1smooth = if !show_smooth_plot then Double.NaN else if IsNaN(close[-1]) then Ema_1 else xxx1;
x1smooth.EnableApproximation();

def x2 = if bar == 1 or bar[1] % ((Ceil(minutes) ) / (GetAggregationPeriod() / 60000)) == 0
then Ema_2
else x2[1];

def xx2 = (if x2 != x2[1] then xx2[1] + 1 else xx1[1]);
def xxx2 = if xx2 != xx2[1] then x2 else Double.NaN;
plot x2smooth = if !show_smooth_plot then Double.NaN else if IsNaN(close[-1]) then Ema_2 else xxx2;
x2smooth.EnableApproximation();


def x3 = if bar == 1 or bar[1] % ((Ceil(minutes) ) / (GetAggregationPeriod() / 60000)) == 0
then ema_3
else x3[1];

def xx3 = (if x3 != x3[1] then xx3[1] + 1 else xx2[1]);
def xxx3 = if xx3 != xx3[1] then x3 else Double.NaN;
plot x3smooth = if !show_smooth_plot then Double.NaN else if IsNaN(close[-1]) then ema_3 else xxx3;
x3smooth.EnableApproximation();

def x4 = if bar == 1 or bar[1] % ((Ceil(minutes) ) / (GetAggregationPeriod() / 60000)) == 0
then Ema_4
else x4[1];

def xx4 = (if x4 != x4[1] then xx4[1] + 1 else xx2[1]);
def xxx4 = if xx4 != xx4[1] then x4 else Double.NaN;
plot x4smooth = if !show_smooth_plot then Double.NaN else if IsNaN(close[-1]) then ema4 else xxx4;
x4smooth.EnableApproximation();

# --------------------------------------------------- Add Cloud -----------------------------------------------


input ShowfastCloud = yes;

DefineGlobalColor( "Bullish Fast Cloud", CreateColor(0, 204, 204));
DefineGlobalColor( "Bearish Fast Cloud", color.light_orange);

#AddCloud(if ShowfastCloud then scalp_ema else Double.NaN, ema_2, GlobalColor("Bullish Fast Cloud"), GlobalColor("Bearish Fast Cloud")); (This works but plots jagged cloud)
AddCloud(if ShowfastCloud then xxx else Double.NaN, xxx3, GlobalColor("Bullish Fast Cloud"), GlobalColor("Bearish Fast Cloud"));


input ShowSlowCloud = yes;

DefineGlobalColor( "Bullish Slow Cloud", color.lime);
DefineGlobalColor( "Bearish Slow Cloud", color.yellow);

AddCloud(if ShowSlowCloud then ema_2 else Double.NaN, ema_3, GlobalColor("Bullish Slow Cloud"), GlobalColor("Bearish Slow Cloud"));
#AddCloud(if ShowSlowCloud then xxx3 else Double.NaN, xxx4, GlobalColor("Bullish Slow Cloud"), GlobalColor("Bearish Slow Cloud"));
 

Attachments

  • Smooth Cloud EMA.PNG
    Smooth Cloud EMA.PNG
    69.6 KB · Views: 55
Last edited by a moderator:
For this MTF code, I've added more moving averages or "ribbon" to it. However, trying to get a cloud to plot on the smooth averages and not sure what I have wrong. The fast cloud code will not print on "smoothed lines", by comparison I'm showing the slow cloud code plots correctly but it's "jagged" based on the original plot. Any help is appreciated as I'd like to set both clouds to post on the smooth plot. Thanks, modified code below:

#Example Smooth Plot HigherAgg on LowerAgg
#Usethinkscript request
#Sleepyz

input show_original_plot = yes;
input show_smooth_plot = yes;

input aggperiod = AggregationPeriod.TWO_MIN;
input scalpema = 5;
input ema1 = 10;
input ema2 = 17;
input ema3 = 25;
input ema4 = 48;
input price = FundamentalType.CLOSE;
input averageType = AverageType.EXPONENTIAL;

plot scalp_ema = MovingAverage(averageType, Fundamental(price, period = aggperiod), scalpema);
scalp_ema.SetHiding(show_original_plot == no);

plot Ema_1 = MovingAverage(averageType, Fundamental(price, period = aggperiod), ema1);
Ema_1.SetHiding(show_original_plot == no);

plot Ema_2 = MovingAverage(averageType, Fundamental(price, period = aggperiod), ema2);
Ema_2.SetHiding(show_original_plot == no);

plot Ema_3 = MovingAverage(averageType, Fundamental(price, period = aggperiod), ema3);
Ema_3.SetHiding(show_original_plot == no);

plot Ema_4 = MovingAverage(averageType, Fundamental(price, period = aggperiod), ema4);
Ema_4.SetHiding(show_original_plot == no);


#Smoothed Plots
def minutes = aggperiod / 60000;
def bar = BarNumber();
def x = if bar == 1 or bar[1] % ((Ceil(minutes) ) / (GetAggregationPeriod() / 60000)) == 0
then scalp_ema
else x[1];

def xx = (if x != x[1] then xx[1] + 1 else xx[1]);
def xxx = if xx != xx[1] then x else Double.NaN;
plot xsmooth = if !show_smooth_plot then Double.NaN else if IsNaN(close[-1]) then scalp_ema else xxx;
xsmooth.EnableApproximation();

def x1 = if bar == 1 or bar[1] % ((Ceil(minutes) ) / (GetAggregationPeriod() / 60000)) == 0
then Ema_1
else x1[1];

def xx1 = (if x1 != x1[1] then xx1[1] + 1 else xx[1]);
def xxx1 = if xx1 != xx1[1] then x1 else Double.NaN;
plot x1smooth = if !show_smooth_plot then Double.NaN else if IsNaN(close[-1]) then Ema_1 else xxx1;
x1smooth.EnableApproximation();

def x2 = if bar == 1 or bar[1] % ((Ceil(minutes) ) / (GetAggregationPeriod() / 60000)) == 0
then Ema_2
else x2[1];

def xx2 = (if x2 != x2[1] then xx2[1] + 1 else xx1[1]);
def xxx2 = if xx2 != xx2[1] then x2 else Double.NaN;
plot x2smooth = if !show_smooth_plot then Double.NaN else if IsNaN(close[-1]) then Ema_2 else xxx2;
x2smooth.EnableApproximation();


def x3 = if bar == 1 or bar[1] % ((Ceil(minutes) ) / (GetAggregationPeriod() / 60000)) == 0
then ema_3
else x3[1];

def xx3 = (if x3 != x3[1] then xx3[1] + 1 else xx2[1]);
def xxx3 = if xx3 != xx3[1] then x3 else Double.NaN;
plot x3smooth = if !show_smooth_plot then Double.NaN else if IsNaN(close[-1]) then ema_3 else xxx3;
x3smooth.EnableApproximation();

def x4 = if bar == 1 or bar[1] % ((Ceil(minutes) ) / (GetAggregationPeriod() / 60000)) == 0
then Ema_4
else x4[1];

def xx4 = (if x4 != x4[1] then xx4[1] + 1 else xx2[1]);
def xxx4 = if xx4 != xx4[1] then x4 else Double.NaN;
plot x4smooth = if !show_smooth_plot then Double.NaN else if IsNaN(close[-1]) then ema4 else xxx4;
x4smooth.EnableApproximation();

# --------------------------------------------------- Add Cloud -----------------------------------------------


input ShowfastCloud = yes;

DefineGlobalColor( "Bullish Fast Cloud", CreateColor(0, 204, 204));
DefineGlobalColor( "Bearish Fast Cloud", color.light_orange);

#AddCloud(if ShowfastCloud then scalp_ema else Double.NaN, ema_2, GlobalColor("Bullish Fast Cloud"), GlobalColor("Bearish Fast Cloud")); (This works but plots jagged cloud)
AddCloud(if ShowfastCloud then xxx else Double.NaN, xxx3, GlobalColor("Bullish Fast Cloud"), GlobalColor("Bearish Fast Cloud"));


input ShowSlowCloud = yes;

DefineGlobalColor( "Bullish Slow Cloud", color.lime);
DefineGlobalColor( "Bearish Slow Cloud", color.yellow);

AddCloud(if ShowSlowCloud then ema_2 else Double.NaN, ema_3, GlobalColor("Bullish Slow Cloud"), GlobalColor("Bearish Slow Cloud"));
#AddCloud(if ShowSlowCloud then xxx3 else Double.NaN, xxx4, GlobalColor("Bullish Slow Cloud"), GlobalColor("Bearish Slow Cloud"));
1. Keep in mind, MTF aggregation has to be HIGHER than your chart.
So your two minute aggregation will ONLY work on a 1min chart

2. Yes, MTF scripts plot with a "jagged" / stepped appearance. There is no smooth.
The higher timeframe will straightline repaint all the candles until it closes and then it will step up to repaint every tick of the next bar. There is no work-around. You are referencing a higher timeframe.

So if the average of a 15min candle is $10 dollars, it will plot a straight line for 15 bars at $10 on a 1min chart.
If the next bar on the 15min chart has an avg is $20 dollars, it will jump up to $20, for 15 bars on a 1min chart.

Thus, whenever, you see a jagged appearance, you will know that the plot is created by a repainting MTF indicator.
 
For this MTF code, I've added more moving averages or "ribbon" to it. However, trying to get a cloud to plot on the smooth averages and not sure what I have wrong. The fast cloud code will not print on "smoothed lines", by comparison I'm showing the slow cloud code plots correctly but it's "jagged" based on the original plot. Any help is appreciated as I'd like to set both clouds to post on the smooth plot. Thanks, modified code below:

As MerryDay stated, the MTF candles are usually jagged looking and so are the clouds associated with them.

Regrettably, the smoothed lines are not real lines created through the function enableapproximation(). So they cannot be used with addcloud.

Therefore, the best solution since you wanted clouds is to have them jagged, which you do not want to see. is to try to hide the jagged portion by increasing the lineweight (line width of the smoothed lines. There is a def lineweight set to 5 within the code. Normally, this would be an input rather than def so you could change it easily at the input screen. However, it is not working reliably as an input, so you will need to change it within the code at the def lineweight.

See if the image below's clouds with the jagged clouds, somewhat hidden by smoothed lines set at lineweight of 5 is okay. Make any adjustments that you need to do.

Screenshot 2024-02-03 154320.png
Code:
#Example Smooth Plot HigherAgg on LowerAgg
#Usethinkscript request
#Sleepyz

input show_original_plot = yes;
input show_smooth_plot = yes;

input aggperiod = AggregationPeriod.TWO_MIN;
input scalpema = 5;
input ema1 = 10;
input ema2 = 17;
input ema3 = 25;
input ema4 = 48;
input price = FundamentalType.CLOSE;
input averageType = AverageType.EXPONENTIAL;

plot scalp_ema = MovingAverage(averageType, Fundamental(price, period = aggperiod), scalpema);
scalp_ema.SetHiding(show_original_plot == no);

plot Ema_1 = MovingAverage(averageType, Fundamental(price, period = aggperiod), ema1);
Ema_1.SetHiding(show_original_plot == no);

plot Ema_2 = MovingAverage(averageType, Fundamental(price, period = aggperiod), ema2);
Ema_2.SetHiding(show_original_plot == no);

plot Ema_3 = MovingAverage(averageType, Fundamental(price, period = aggperiod), ema3);
Ema_3.SetHiding(show_original_plot == no);

plot Ema_4 = if IsNaN(close) then Double.NaN else MovingAverage(averageType, Fundamental(price, period = aggperiod), ema4);
Ema_4.SetHiding(show_original_plot == no);


#Smoothed Plots
def lineweight = 5;
def minutes = aggperiod / 60000;
def bar = BarNumber();
def x = if bar == 1 or bar[1] % ((Ceil(minutes) ) / (GetAggregationPeriod() / 60000)) == 0
then scalp_ema
else x[1];

def xx = (if x != x[1] then xx[1] + 1 else xx[1]);
def xxx = if xx != xx[1] then x else Double.NaN;
plot xsmooth = if !show_smooth_plot then Double.NaN else if IsNaN(close[-1]) then scalp_ema else xxx;
xsmooth.EnableApproximation();
xsmooth.SetLineWeight(lineweight);

def x1 = if bar == 1 or bar[1] % ((Ceil(minutes) ) / (GetAggregationPeriod() / 60000)) == 0
then Ema_1
else x1[1];

def xx1 = (if x1 != x1[1] then xx1[1] + 1 else xx[1]);
def xxx1 = if xx1 != xx1[1] then x1 else Double.NaN;
plot x1smooth = if !show_smooth_plot then Double.NaN else if IsNaN(close[-1]) then Ema_1 else xxx1;
x1smooth.EnableApproximation();
x1smooth.SetLineWeight(lineweight);

def x2 = if bar == 1 or bar[1] % ((Ceil(minutes) ) / (GetAggregationPeriod() / 60000)) == 0
then Ema_2
else x2[1];

def xx2 = (if x2 != x2[1] then xx2[1] + 1 else xx1[1]);
def xxx2 = if xx2 != xx2[1] then x2 else Double.NaN;
plot x2smooth = if !show_smooth_plot then Double.NaN else if IsNaN(close[-1]) then Ema_2 else xxx2;
x2smooth.EnableApproximation();
x2smooth.SetLineWeight(lineweight);

def x3 = if bar == 1 or bar[1] % ((Ceil(minutes) ) / (GetAggregationPeriod() / 60000)) == 0
then Ema_3
else x3[1];

def xx3 = (if x3 != x3[1] then xx3[1] + 1 else xx2[1]);
def xxx3 = if xx3 != xx3[1] then x3 else Double.NaN;
plot x3smooth = if !show_smooth_plot then Double.NaN else if IsNaN(close[-1]) then Ema_3 else xxx3;
x3smooth.EnableApproximation();
x3smooth.SetLineWeight(lineweight);

def x4 = if bar == 1 or bar[1] % ((Ceil(minutes) ) / (GetAggregationPeriod() / 60000)) == 0
then Ema_4
else x4[1];

def xx4 = (if x4 != x4[1] then xx4[1] + 1 else xx2[1]);
def xxx4 = if xx4 != xx4[1] then x4 else Double.NaN;
plot x4smooth = if !show_smooth_plot then Double.NaN  else if IsNaN(close[-1]) then ema4 else xxx4;
x4smooth.EnableApproximation();
x4smooth.SetLineWeight(lineweight);
# --------------------------------------------------- Add Cloud -----------------------------------------------


input ShowfastCloud = yes;

DefineGlobalColor( "Bullish Fast Cloud", CreateColor(0, 204, 204));
DefineGlobalColor( "Bearish Fast Cloud", Color.LIGHT_ORANGE);

AddCloud(if ShowfastCloud then scalp_ema else Double.NaN, Ema_1, GlobalColor("Bullish Fast Cloud"), GlobalColor("Bearish Fast Cloud"));# (This works but plots jagged cloud)
AddCloud(if ShowfastCloud then Ema_1 else Double.NaN, Ema_2, GlobalColor("Bullish Fast Cloud"), GlobalColor("Bearish Fast Cloud"));


input ShowSlowCloud = yes;

DefineGlobalColor( "Bullish Slow Cloud", Color.LIME);
DefineGlobalColor( "Bearish Slow Cloud", Color.YELLOW);

AddCloud(if ShowSlowCloud then Ema_2 else Double.NaN, Ema_3, GlobalColor("Bullish Slow Cloud"), GlobalColor("Bearish Slow Cloud"));
AddCloud(if ShowSlowCloud then Ema_3 else Double.NaN, Ema_4, GlobalColor("Bullish Slow Cloud"), GlobalColor("Bearish Slow Cloud"));
 
As MerryDay stated, the MTF candles are usually jagged looking and so are the clouds associated with them.

Regrettably, the smoothed lines are not real lines created through the function enableapproximation(). So they cannot be used with addcloud.

Therefore, the best solution since you wanted clouds is to have them jagged, which you do not want to see. is to try to hide the jagged portion by increasing the lineweight (line width of the smoothed lines. There is a def lineweight set to 5 within the code. Normally, this would be an input rather than def so you could change it easily at the input screen. However, it is not working reliably as an input, so you will need to change it within the code at the def lineweight.

See if the image below's clouds with the jagged clouds, somewhat hidden by smoothed lines set at lineweight of 5 is okay. Make any adjustments that you need to do.
@MerryDay @SleepyZ Thank you both for the response, I didn't realize the smoothed lines could not be used as a reference. Much appreciated, in the same veign just to clarify from the current thread and this one https://usethinkscript.com/threads/aggregationperiod-variable.10625/ (I've read both repeatedly) there is also no way for TOS to recognize the chart time frame you are currently on to reference in a formula correct? i.e. can't define current time frame as an aggregation to utilize in a formula? Thanks again for the prompt response. Below is my attempted solution to this issue. For anyone users of script below please read instructions on the top of code before utilizing.

# MTF Moving Average Crossover With Arrows, Alerts, Crossing Count and Bubble at Cross
# Mobius
# Chat Room Request 01.25.2017
# Modified a bit by BenTen
# 02/03/2024 Modified further by GoLo to plot higher aggregation moving averages on lower chart timeframes. Please read instructions below:

# Logic is simple math to take the moving average (ma) you prefer displayed on the time frame you desire(target aggregation) on any chart timeframe lower than the desired time frame (chart aggregation).

# For example assuming we want a 10 moving average from a 5min aggregation (target aggregation) to plot on the current 2 min chart (chart aggregation) the formula would be (without coding): plot movingAverage length * (target aggregation / chart aggregation) or illustrated in numbers: = 10 * (5/2) = 25 where 25 would be the movingaverage length you'd want to see plotted which approximates the 10 ma on a 5 min timeframe when you are currently on a 2 min chart. Ideally would like the chart aggregation to automatically pull from your current chart so you'd only need to select the moving average you desire and the timeframe you'd like to see that moving average. However, my understanding is that it is not possible to utilize the current aggregation as a reference in any formulas. If somebody knows how to do this please feel free to upgrade code.

# To utilize simply select your current timeframe you'd like to view (must match your current chart) and then select the timeframe you'd prefer the moving average to plot upon (both in minutes).

#Last select the actual moving average lengths you prefer and/or type i.e. simple,exponential, etc.

# Added bar coloring options similar to Bjorgum Triple EMA coloring scheme

# Cloud colors and other colors are adjustable under Globals at bottom

# Credit for various ideas go to Bjorgum Triple EMA (paint bars) and Saty Mahajan (multicolored ribbon).


DefineGlobalColor( "Bull Lines", CreateColor(0, 204, 204));
DefineGlobalColor( "Bear Lines", Color.LIGHT_ORANGE);

# --------------------------------------------------- Set aggregation conversion --------------------------------
input chart_timeframe_min = 1;
input target_aggregation_min = 2;
;

# --------------------------------------------------- Add 5 Scalp EMA -----------------------------------------------

input ScalpEMA = 5;


input averageTypeS = AverageType.EXPONENTIAL;
def priceS = close;

#DefineGlobalColor( "Fast EMA+", CreateColor(0, 204, 204));
#DefineGlobalColor( "Fast EMA-", color.light_orange);

plot Scalp_EMA = MovingAverage(averageTypeS, priceS, ScalpEMA * target_aggregation_min / chart_timeframe_min);
Scalp_EMA.SetStyle(Curve.SHORT_DASH);
Scalp_EMA.AssignValueColor(if Scalp_EMA >= Scalp_EMA[1] then GlobalColor("Bull Lines") else GlobalColor("Bear Lines"));

# -------------------------------------------- EMA 1 -----------------------------------------


input EMA1 = 10;

input averageType = AverageType.EXPONENTIAL;
def price = close;

#DefineGlobalColor( "Fast EMA+", CreateColor(0, 204, 204));
#DefineGlobalColor( "Fast EMA-", color.light_orange);

plot EMA_1 = MovingAverage(averageType, price, EMA1 * target_aggregation_min / chart_timeframe_min);
EMA_1.SetStyle(Curve.SHORT_DASH);
EMA_1.AssignValueColor(if EMA_1 >= EMA_1[1] then GlobalColor("Bull Lines") else GlobalColor("Bear Lines"));

#EMA_1.SetDefaultColor(GetColor(9));


# -------------------------------------------- EMA 2 -----------------------------------------


input EMA2 = 17;

input averageType2 = AverageType.EXPONENTIAL;
def price2 = close;

#DefineGlobalColor( "Slow EMA+", CreateColor(0, 204, 204));
#DefineGlobalColor( "Slow EMA-", color.light_orange);

plot EMA_2 = MovingAverage(averageType2, price2, EMA2 * target_aggregation_min / chart_timeframe_min);
EMA_2.SetStyle(Curve.SHORT_DASH);
EMA_2.AssignValueColor(if EMA_2 >= EMA_2[1] then GlobalColor("Bull Lines") else GlobalColor("Bear Lines"));


#EMA_2.SetDefaultColor(GetColor(12));

# -------------------------------------------- EMA 3 -----------------------------------------


input EMA3 = 25;

input averageType3 = AverageType.EXPONENTIAL;
def price3 = close;

#DefineGlobalColor( "EMA3+", CreateColor(0, 204, 204));
#DefineGlobalColor( "EMA3-", color.light_orange);


plot EMA_3 = MovingAverage(averageType3, price3, EMA3 * target_aggregation_min / chart_timeframe_min);
EMA_3.AssignValueColor(if EMA_3 >= EMA_3[1] then GlobalColor("Bull Lines") else GlobalColor("Bear Lines"));

#EMA_3.SetDefaultColor(GetColor(5));


# --------------------------------------------------- Add Cloud -----------------------------------------------
DefineGlobalColor( "Bullish Fast Cloud", CreateColor(0, 204, 204));
DefineGlobalColor( "Bearish Fast Cloud", Color.LIGHT_ORANGE);

input ShowScalpCloud = no;

#DefineGlobalColor( "Bullish Scalp Cloud", CreateColor(0, 204, 204));
#DefineGlobalColor( "Bearish Scalp Cloud", color.light_orange);

AddCloud(if ShowScalpCloud then Scalp_EMA else Double.NaN, EMA_1, GlobalColor("Bullish Fast Cloud"), GlobalColor("Bearish Fast Cloud"));


input ShowfastCloud = yes;

DefineGlobalColor( "Bullish Fast Cloud", CreateColor(0, 204, 204));
DefineGlobalColor( "Bearish Fast Cloud", Color.LIGHT_ORANGE);

AddCloud(if ShowfastCloud then EMA_1 else Double.NaN, EMA_2, GlobalColor("Bullish Fast Cloud"), GlobalColor("Bearish Fast Cloud"));


input ShowSlowCloud = yes;

DefineGlobalColor( "Bullish Slow Cloud", Color.LIME);
DefineGlobalColor( "Bearish Slow Cloud", Color.YELLOW);

AddCloud(if ShowSlowCloud then EMA_2 else Double.NaN, EMA_3, GlobalColor("Bullish Slow Cloud"), GlobalColor("Bearish Slow Cloud"));


# --------------------------------------- EMA Cross Signal ----------------------------------------
input showEMACross = no;

plot CrossUp = if EMA_1 crosses above EMA_2 then EMA_2 else Double.NaN;
plot CrossDown = if EMA_1 crosses below EMA_2 then EMA_2 else Double.NaN;

CrossUp.SetHiding(!showEMACross);
CrossDown.SetHiding(!showEMACross);

CrossUp.SetDefaultColor(Color.WHITE);
CrossUp.SetPaintingStrategy(PaintingStrategy.ARROW_UP);
CrossDown.SetDefaultColor(Color.WHITE);
CrossDown.SetPaintingStrategy(PaintingStrategy.ARROW_DOWN);


# =========================== Add PB Cloud Option =======================================
input EMApb = 13;

input averageTypepb = AverageType.EXPONENTIAL;
def pricepb = close;

DefineGlobalColor( "EMApb+", GetColor (8));
DefineGlobalColor( "EMA4-", GetColor (8));


plot EMA_pb = MovingAverage(averageTypepb, pricepb, EMApb * target_aggregation_min / chart_timeframe_min);
EMA_pb.AssignValueColor(if EMA_pb >= EMA_pb[1] then GlobalColor("EMApb+") else GlobalColor("EMApb-"));


input PBCloud = Yes;


DefineGlobalColor( "EMAPB+", CreateColor(201, 255, 234));
DefineGlobalColor( "EMAPB-", CreateColor(255, 105, 105));


input EMAPBfast = 12;
input EMAPBslow = 14;


def EMA_PBFast = if PBCloud then ExpAverage(close, EMAPBfast * target_aggregation_min / chart_timeframe_min) else Double.NaN;
def EMA_PBSlow = if PBCloud then ExpAverage(close, EMAPBslow * target_aggregation_min / chart_timeframe_min) else Double.NaN;


AddCloud( EMA_PBFast, EMA_PBSlow, GlobalColor("EMAPB+"), GlobalColor("EMAPB-"));

# ---------------------------------------------------- PB Alerts ----------------------------------

def UpSignal = price crosses below EMA_PBFast and EMA_1 > EMA_2;
def DownSignal = price crosses above EMA_PBFast and EMA_1 < EMA_2;


#UpSignal.SetDefaultColor(Color.UPTICK);
#UpSignal.SetPaintingStrategy(PaintingStrategy.BOOLEAN_ARROW_UP);
#DownSignal.SetDefaultColor(Color.DOWNTICK);
#DownSignal.SetPaintingStrategy(PaintingStrategy.BOOLEAN_ARROW_DOWN);

# Alerts
Alert(UpSignal, "PB Bullish", Alert.BAR, Sound.Ding);
Alert(DownSignal, "PB Bearish", Alert.BAR, Sound.Bell);

# -------------------------------------------- Paint Bars Scalp ----------------------------------
DefineGlobalColor( "Bull Candle", CreateColor(100, 181, 246));
DefineGlobalColor( "Bear Candle", color.LIGHT_ORANGE);
DefineGlobalColor( "Neutral Candle", color.LIGHT_GRAY);

input paintbars_scalp = no;

AssignPriceColor(
if paintbars_scalp and close > scalp_EMA and close > EMA_1 then GlobalColor("Bull Candle")
else if paintbars_scalp and close < scalp_EMA and close < EMA_1 then GlobalColor("Bear Candle")
else if paintbars_scalp then GlobalColor("Neutral Candle")
else Color.CURRENT
);

# -------------------------------------------- Paint Bars ----------------------------------


input paintbars = no;

AssignPriceColor(
if paintbars and close > EMA_1 and close > EMA_2 then GlobalColor("Bull Candle")
else if paintbars and close < EMA_1 and close < EMA_2 then GlobalColor("Bear Candle")
else if paintbars then GlobalColor("Neutral Candle")
else Color.CURRENT
);
 

Attachments

  • Smooth EMA Cloud.PNG
    Smooth EMA Cloud.PNG
    62.9 KB · Views: 57
Last edited:
@MerryDay @SleepyZ Thank you both for the response, I didn't realize the smoothed lines could not be used as a reference. Much appreciated, in the same veign just to clarify from the current thread and this one https://usethinkscript.com/threads/aggregationperiod-variable.10625/ (I've read both repeatedly) there is also no way for TOS to recognize the chart time frame you are currently on to reference in a formula correct? i.e. can't define current time frame as an aggregation to utilize in a formula? Thanks again for the prompt response. Below is my attempted solution to this issue. For anyone users of script below please read instructions on the top of code before utilizing.

# MTF Moving Average Crossover With Arrows, Alerts, Crossing Count and Bubble at Cross
# Mobius
# Chat Room Request 01.25.2017
# Modified a bit by BenTen
# 02/03/2024 Modified further by GoLo to plot higher aggregation moving averages on lower chart timeframes. Please read instructions below:

# Logic is simple math to take the moving average (ma) you prefer displayed on the time frame you desire(target aggregation) on any chart timeframe lower than the desired time frame (chart aggregation).

# For example assuming we want a 10 moving average from a 5min aggregation (target aggregation) to plot on the current 2 min chart (chart aggregation) the formula would be (without coding): plot movingAverage length * (target aggregation / chart aggregation) or illustrated in numbers: = 10 * (5/2) = 25 where 25 would be the movingaverage length you'd want to see plotted which approximates the 10 ma on a 5 min timeframe when you are currently on a 2 min chart. Ideally would like the chart aggregation to automatically pull from your current chart so you'd only need to select the moving average you desire and the timeframe you'd like to see that moving average. However, my understanding is that it is not possible to utilize the current aggregation as a reference in any formulas. If somebody knows how to do this please feel free to upgrade code.

# To utilize simply select your current timeframe you'd like to view (must match your current chart) and then select the timeframe you'd prefer the moving average to plot upon (both in minutes).

#Last select the actual moving average lengths you prefer and/or type i.e. simple,exponential, etc.

# Added bar coloring options similar to Bjorgum Triple EMA coloring scheme

# Cloud colors and other colors are adjustable under Globals at bottom

# Credit for various ideas go to Bjorgum Triple EMA (paint bars) and Saty Mahajan (multicolored ribbon).


DefineGlobalColor( "Bull Lines", CreateColor(0, 204, 204));
DefineGlobalColor( "Bear Lines", Color.LIGHT_ORANGE);

# --------------------------------------------------- Set aggregation conversion --------------------------------
input chart_timeframe_min = 1;
input target_aggregation_min = 2;
;

# --------------------------------------------------- Add 5 Scalp EMA -----------------------------------------------

input ScalpEMA = 5;


input averageTypeS = AverageType.EXPONENTIAL;
def priceS = close;

#DefineGlobalColor( "Fast EMA+", CreateColor(0, 204, 204));
#DefineGlobalColor( "Fast EMA-", color.light_orange);

plot Scalp_EMA = MovingAverage(averageTypeS, priceS, ScalpEMA * target_aggregation_min / chart_timeframe_min);
Scalp_EMA.SetStyle(Curve.SHORT_DASH);
Scalp_EMA.AssignValueColor(if Scalp_EMA >= Scalp_EMA[1] then GlobalColor("Bull Lines") else GlobalColor("Bear Lines"));

# -------------------------------------------- EMA 1 -----------------------------------------


input EMA1 = 10;

input averageType = AverageType.EXPONENTIAL;
def price = close;

#DefineGlobalColor( "Fast EMA+", CreateColor(0, 204, 204));
#DefineGlobalColor( "Fast EMA-", color.light_orange);

plot EMA_1 = MovingAverage(averageType, price, EMA1 * target_aggregation_min / chart_timeframe_min);
EMA_1.SetStyle(Curve.SHORT_DASH);
EMA_1.AssignValueColor(if EMA_1 >= EMA_1[1] then GlobalColor("Bull Lines") else GlobalColor("Bear Lines"));

#EMA_1.SetDefaultColor(GetColor(9));


# -------------------------------------------- EMA 2 -----------------------------------------


input EMA2 = 17;

input averageType2 = AverageType.EXPONENTIAL;
def price2 = close;

#DefineGlobalColor( "Slow EMA+", CreateColor(0, 204, 204));
#DefineGlobalColor( "Slow EMA-", color.light_orange);

plot EMA_2 = MovingAverage(averageType2, price2, EMA2 * target_aggregation_min / chart_timeframe_min);
EMA_2.SetStyle(Curve.SHORT_DASH);
EMA_2.AssignValueColor(if EMA_2 >= EMA_2[1] then GlobalColor("Bull Lines") else GlobalColor("Bear Lines"));


#EMA_2.SetDefaultColor(GetColor(12));

# -------------------------------------------- EMA 3 -----------------------------------------


input EMA3 = 25;

input averageType3 = AverageType.EXPONENTIAL;
def price3 = close;

#DefineGlobalColor( "EMA3+", CreateColor(0, 204, 204));
#DefineGlobalColor( "EMA3-", color.light_orange);


plot EMA_3 = MovingAverage(averageType3, price3, EMA3 * target_aggregation_min / chart_timeframe_min);
EMA_3.AssignValueColor(if EMA_3 >= EMA_3[1] then GlobalColor("Bull Lines") else GlobalColor("Bear Lines"));

#EMA_3.SetDefaultColor(GetColor(5));


# --------------------------------------------------- Add Cloud -----------------------------------------------
DefineGlobalColor( "Bullish Fast Cloud", CreateColor(0, 204, 204));
DefineGlobalColor( "Bearish Fast Cloud", Color.LIGHT_ORANGE);

input ShowScalpCloud = no;

#DefineGlobalColor( "Bullish Scalp Cloud", CreateColor(0, 204, 204));
#DefineGlobalColor( "Bearish Scalp Cloud", color.light_orange);

AddCloud(if ShowScalpCloud then Scalp_EMA else Double.NaN, EMA_1, GlobalColor("Bullish Fast Cloud"), GlobalColor("Bearish Fast Cloud"));


input ShowfastCloud = yes;

DefineGlobalColor( "Bullish Fast Cloud", CreateColor(0, 204, 204));
DefineGlobalColor( "Bearish Fast Cloud", Color.LIGHT_ORANGE);

AddCloud(if ShowfastCloud then EMA_1 else Double.NaN, EMA_2, GlobalColor("Bullish Fast Cloud"), GlobalColor("Bearish Fast Cloud"));


input ShowSlowCloud = yes;

DefineGlobalColor( "Bullish Slow Cloud", Color.LIME);
DefineGlobalColor( "Bearish Slow Cloud", Color.YELLOW);

AddCloud(if ShowSlowCloud then EMA_2 else Double.NaN, EMA_3, GlobalColor("Bullish Slow Cloud"), GlobalColor("Bearish Slow Cloud"));


# --------------------------------------- EMA Cross Signal ----------------------------------------
input showEMACross = no;

plot CrossUp = if EMA_1 crosses above EMA_2 then EMA_2 else Double.NaN;
plot CrossDown = if EMA_1 crosses below EMA_2 then EMA_2 else Double.NaN;

CrossUp.SetHiding(!showEMACross);
CrossDown.SetHiding(!showEMACross);

CrossUp.SetDefaultColor(Color.WHITE);
CrossUp.SetPaintingStrategy(PaintingStrategy.ARROW_UP);
CrossDown.SetDefaultColor(Color.WHITE);
CrossDown.SetPaintingStrategy(PaintingStrategy.ARROW_DOWN);


# =========================== Add PB Cloud Option =======================================
input EMApb = 13;

input averageTypepb = AverageType.EXPONENTIAL;
def pricepb = close;

DefineGlobalColor( "EMApb+", GetColor (8));
DefineGlobalColor( "EMA4-", GetColor (8));


plot EMA_pb = MovingAverage(averageTypepb, pricepb, EMApb * target_aggregation_min / chart_timeframe_min);
EMA_pb.AssignValueColor(if EMA_pb >= EMA_pb[1] then GlobalColor("EMApb+") else GlobalColor("EMApb-"));


input PBCloud = Yes;


DefineGlobalColor( "EMAPB+", CreateColor(201, 255, 234));
DefineGlobalColor( "EMAPB-", CreateColor(255, 105, 105));


input EMAPBfast = 12;
input EMAPBslow = 14;


def EMA_PBFast = if PBCloud then ExpAverage(close, EMAPBfast * target_aggregation_min / chart_timeframe_min) else Double.NaN;
def EMA_PBSlow = if PBCloud then ExpAverage(close, EMAPBslow * target_aggregation_min / chart_timeframe_min) else Double.NaN;


AddCloud( EMA_PBFast, EMA_PBSlow, GlobalColor("EMAPB+"), GlobalColor("EMAPB-"));

# ---------------------------------------------------- PB Alerts ----------------------------------

def UpSignal = price crosses below EMA_PBFast and EMA_1 > EMA_2;
def DownSignal = price crosses above EMA_PBFast and EMA_1 < EMA_2;


#UpSignal.SetDefaultColor(Color.UPTICK);
#UpSignal.SetPaintingStrategy(PaintingStrategy.BOOLEAN_ARROW_UP);
#DownSignal.SetDefaultColor(Color.DOWNTICK);
#DownSignal.SetPaintingStrategy(PaintingStrategy.BOOLEAN_ARROW_DOWN);

# Alerts
Alert(UpSignal, "PB Bullish", Alert.BAR, Sound.Ding);
Alert(DownSignal, "PB Bearish", Alert.BAR, Sound.Bell);

# -------------------------------------------- Paint Bars Scalp ----------------------------------
DefineGlobalColor( "Bull Candle", CreateColor(100, 181, 246));
DefineGlobalColor( "Bear Candle", color.LIGHT_ORANGE);
DefineGlobalColor( "Neutral Candle", color.LIGHT_GRAY);

input paintbars_scalp = no;

AssignPriceColor(
if paintbars_scalp and close > scalp_EMA and close > EMA_1 then GlobalColor("Bull Candle")
else if paintbars_scalp and close < scalp_EMA and close < EMA_1 then GlobalColor("Bear Candle")
else if paintbars_scalp then GlobalColor("Neutral Candle")
else Color.CURRENT
);

# -------------------------------------------- Paint Bars ----------------------------------


input paintbars = no;

AssignPriceColor(
if paintbars and close > EMA_1 and close > EMA_2 then GlobalColor("Bull Candle")
else if paintbars and close < EMA_1 and close < EMA_2 then GlobalColor("Bear Candle")
else if paintbars then GlobalColor("Neutral Candle")
else Color.CURRENT
);

The following will auto determine the chart time. See the label.

The method of increasing the length is a method that has been offered here. For small differences, like 1m to 2m, between the chart timeframe and the target timeframe, they appear to be "close". As you get larger differences, the differences appear to be greater. See the 15m image below.

It is all up to what the user is willing to accept.

Hope this helps!

Screenshot 2024-02-04 132434.png
Code:
# MTF Moving Average Crossover With Arrows, Alerts, Crossing Count and Bubble at Cross
# Mobius
# Chat Room Request 01.25.2017
# Modified a bit by BenTen
# 02/03/2024 Modified further by GoLo to plot higher aggregation moving averages on lower chart timeframes. Please read instructions below:

# Logic is simple math to take the moving average (ma) you prefer displayed on the time frame you desire(target aggregation) on any chart timeframe lower than the desired time frame (chart aggregation).

# For example assuming we want a 10 moving average from a 5min aggregation (target aggregation) to plot on the current 2 min chart (chart aggregation) the formula would be (without coding): plot movingAverage length * (target aggregation / chart aggregation) or illustrated in numbers: = 10 * (5/2) = 25 where 25 would be the movingaverage length you'd want to see plotted which approximates the 10 ma on a 5 min timeframe when you are currently on a 2 min chart. Ideally would like the chart aggregation to automatically pull from your current chart so you'd only need to select the moving average you desire and the timeframe you'd like to see that moving average. However, my understanding is that it is not possible to utilize the current aggregation as a reference in any formulas. If somebody knows how to do this please feel free to upgrade code.

# To utilize simply select your current timeframe you'd like to view (must match your current chart) and then select the timeframe you'd prefer the moving average to plot upon (both in minutes).

#Last select the actual moving average lengths you prefer and/or type i.e. simple,exponential, etc.

# Added bar coloring options similar to Bjorgum Triple EMA coloring scheme

# Cloud colors and other colors are adjustable under Globals at bottom

# Credit for various ideas go to Bjorgum Triple EMA (paint bars) and Saty Mahajan (multicolored ribbon).


DefineGlobalColor( "Bull Lines", CreateColor(0, 204, 204));
DefineGlobalColor( "Bear Lines", Color.LIGHT_ORANGE);

# --------------------------------------------------- Set aggregation conversion --------------------------------
#input chart_timeframe_min = 1;
def chart_timeframe_min = getaggregationPeriod()/60000;
input target_aggregation_min = 2;
input label = yes;
addlabel(label, "Chart:  " +chart_timeframe_min +"m\n | Target: "+ target_aggregation_min +"m",  color.yellow);

;

# --------------------------------------------------- Add 5 Scalp EMA -----------------------------------------------

input ScalpEMA = 5;


input averageTypeS = AverageType.EXPONENTIAL;
def priceS = close;

#DefineGlobalColor( "Fast EMA+", CreateColor(0, 204, 204));
#DefineGlobalColor( "Fast EMA-", color.light_orange);

plot Scalp_EMA = MovingAverage(averageTypeS, priceS, ScalpEMA * target_aggregation_min / chart_timeframe_min);
Scalp_EMA.SetStyle(Curve.SHORT_DASH);
Scalp_EMA.AssignValueColor(if Scalp_EMA >= Scalp_EMA[1] then GlobalColor("Bull Lines") else GlobalColor("Bear Lines"));

# -------------------------------------------- EMA 1 -----------------------------------------


input EMA1 = 10;

input averageType = AverageType.EXPONENTIAL;
def price = close;

#DefineGlobalColor( "Fast EMA+", CreateColor(0, 204, 204));
#DefineGlobalColor( "Fast EMA-", color.light_orange);

plot EMA_1 = MovingAverage(averageType, price, EMA1 * target_aggregation_min / chart_timeframe_min);
EMA_1.SetStyle(Curve.SHORT_DASH);
EMA_1.AssignValueColor(if EMA_1 >= EMA_1[1] then GlobalColor("Bull Lines") else GlobalColor("Bear Lines"));

#EMA_1.SetDefaultColor(GetColor(9));


# -------------------------------------------- EMA 2 -----------------------------------------


input EMA2 = 17;

input averageType2 = AverageType.EXPONENTIAL;
def price2 = close;

#DefineGlobalColor( "Slow EMA+", CreateColor(0, 204, 204));
#DefineGlobalColor( "Slow EMA-", color.light_orange);

plot EMA_2 = MovingAverage(averageType2, price2, EMA2 * target_aggregation_min / chart_timeframe_min);
EMA_2.SetStyle(Curve.SHORT_DASH);
EMA_2.AssignValueColor(if EMA_2 >= EMA_2[1] then GlobalColor("Bull Lines") else GlobalColor("Bear Lines"));


#EMA_2.SetDefaultColor(GetColor(12));

# -------------------------------------------- EMA 3 -----------------------------------------


input EMA3 = 25;

input averageType3 = AverageType.EXPONENTIAL;
def price3 = close;

#DefineGlobalColor( "EMA3+", CreateColor(0, 204, 204));
#DefineGlobalColor( "EMA3-", color.light_orange);


plot EMA_3 = MovingAverage(averageType3, price3, EMA3 * target_aggregation_min / chart_timeframe_min);
EMA_3.AssignValueColor(if EMA_3 >= EMA_3[1] then GlobalColor("Bull Lines") else GlobalColor("Bear Lines"));

#EMA_3.SetDefaultColor(GetColor(5));


# --------------------------------------------------- Add Cloud -----------------------------------------------
DefineGlobalColor( "Bullish Fast Cloud", CreateColor(0, 204, 204));
DefineGlobalColor( "Bearish Fast Cloud", Color.LIGHT_ORANGE);

input ShowScalpCloud = no;

#DefineGlobalColor( "Bullish Scalp Cloud", CreateColor(0, 204, 204));
#DefineGlobalColor( "Bearish Scalp Cloud", color.light_orange);

AddCloud(if ShowScalpCloud then Scalp_EMA else Double.NaN, EMA_1, GlobalColor("Bullish Fast Cloud"), GlobalColor("Bearish Fast Cloud"));


input ShowfastCloud = yes;

DefineGlobalColor( "Bullish Fast Cloud", CreateColor(0, 204, 204));
DefineGlobalColor( "Bearish Fast Cloud", Color.LIGHT_ORANGE);

AddCloud(if ShowfastCloud then EMA_1 else Double.NaN, EMA_2, GlobalColor("Bullish Fast Cloud"), GlobalColor("Bearish Fast Cloud"));


input ShowSlowCloud = yes;

DefineGlobalColor( "Bullish Slow Cloud", Color.LIME);
DefineGlobalColor( "Bearish Slow Cloud", Color.YELLOW);

AddCloud(if ShowSlowCloud then EMA_2 else Double.NaN, EMA_3, GlobalColor("Bullish Slow Cloud"), GlobalColor("Bearish Slow Cloud"));


# --------------------------------------- EMA Cross Signal ----------------------------------------
input showEMACross = no;

plot CrossUp = if EMA_1 crosses above EMA_2 then EMA_2 else Double.NaN;
plot CrossDown = if EMA_1 crosses below EMA_2 then EMA_2 else Double.NaN;

CrossUp.SetHiding(!showEMACross);
CrossDown.SetHiding(!showEMACross);

CrossUp.SetDefaultColor(Color.WHITE);
CrossUp.SetPaintingStrategy(PaintingStrategy.ARROW_UP);
CrossDown.SetDefaultColor(Color.WHITE);
CrossDown.SetPaintingStrategy(PaintingStrategy.ARROW_DOWN);


# =========================== Add PB Cloud Option =======================================
input EMApb = 13;

input averageTypepb = AverageType.EXPONENTIAL;
def pricepb = close;

DefineGlobalColor( "EMApb+", GetColor (8));
DefineGlobalColor( "EMA4-", GetColor (8));


plot EMA_pb = MovingAverage(averageTypepb, pricepb, EMApb * target_aggregation_min / chart_timeframe_min);
EMA_pb.AssignValueColor(if EMA_pb >= EMA_pb[1] then GlobalColor("EMApb+") else GlobalColor("EMApb-"));


input PBCloud = Yes;


DefineGlobalColor( "EMAPB+", CreateColor(201, 255, 234));
DefineGlobalColor( "EMAPB-", CreateColor(255, 105, 105));


input EMAPBfast = 12;
input EMAPBslow = 14;


def EMA_PBFast = if PBCloud then ExpAverage(close, EMAPBfast * target_aggregation_min / chart_timeframe_min) else Double.NaN;
def EMA_PBSlow = if PBCloud then ExpAverage(close, EMAPBslow * target_aggregation_min / chart_timeframe_min) else Double.NaN;


AddCloud( EMA_PBFast, EMA_PBSlow, GlobalColor("EMAPB+"), GlobalColor("EMAPB-"));

# ---------------------------------------------------- PB Alerts ----------------------------------

def UpSignal = price crosses below EMA_PBFast and EMA_1 > EMA_2;
def DownSignal = price crosses above EMA_PBFast and EMA_1 < EMA_2;


#UpSignal.SetDefaultColor(Color.UPTICK);
#UpSignal.SetPaintingStrategy(PaintingStrategy.BOOLEAN_ARROW_UP);
#DownSignal.SetDefaultColor(Color.DOWNTICK);
#DownSignal.SetPaintingStrategy(PaintingStrategy.BOOLEAN_ARROW_DOWN);

# Alerts
Alert(UpSignal, "PB Bullish", Alert.BAR, Sound.Ding);
Alert(DownSignal, "PB Bearish", Alert.BAR, Sound.Bell);

# -------------------------------------------- Paint Bars Scalp ----------------------------------
DefineGlobalColor( "Bull Candle", CreateColor(100, 181, 246));
DefineGlobalColor( "Bear Candle", color.LIGHT_ORANGE);
DefineGlobalColor( "Neutral Candle", color.LIGHT_GRAY);

input paintbars_scalp = no;

AssignPriceColor(
if paintbars_scalp and close > scalp_EMA and close > EMA_1 then GlobalColor("Bull Candle")
else if paintbars_scalp and close < scalp_EMA and close < EMA_1 then GlobalColor("Bear Candle")
else if paintbars_scalp then GlobalColor("Neutral Candle")
else Color.CURRENT
);

# -------------------------------------------- Paint Bars ----------------------------------


input paintbars = no;

AssignPriceColor(
if paintbars and close > EMA_1 and close > EMA_2 then GlobalColor("Bull Candle")
else if paintbars and close < EMA_1 and close < EMA_2 then GlobalColor("Bear Candle")
else if paintbars then GlobalColor("Neutral Candle")
else Color.CURRENT
);
 
The following will auto determine the chart time. See the label.

The method of increasing the length is a method that has been offered here. For small differences, like 1m to 2m, between the chart timeframe and the target timeframe, they appear to be "close". As you get larger differences, the differences appear to be greater. See the 15m image below.

It is all up to what the user is willing to accept.

Hope this helps!
@SleepyZ thank you so much! I spent hours trying to automate the current aggregation. Sincerly appreciated!
 

Join useThinkScript to post your question to a community of 21,000+ developers and traders.

Similar threads

Not the exact question you're looking for?

Start a new thread and receive assistance from our community.

87k+ Posts
360 Online
Create Post

Similar threads

Similar threads

The Market Trading Game Changer

Join 2,500+ subscribers inside the useThinkScript VIP Membership Club
  • Exclusive indicators
  • Proven strategies & setups
  • Private Discord community
  • ‘Buy The Dip’ signal alerts
  • Exclusive members-only content
  • Add-ons and resources
  • 1 full year of unlimited support

Frequently Asked Questions

What is useThinkScript?

useThinkScript is the #1 community of stock market investors using indicators and other tools to power their trading strategies. Traders of all skill levels use our forums to learn about scripting and indicators, help each other, and discover new ways to gain an edge in the markets.

How do I get started?

We get it. Our forum can be intimidating, if not overwhelming. With thousands of topics, tens of thousands of posts, our community has created an incredibly deep knowledge base for stock traders. No one can ever exhaust every resource provided on our site.

If you are new, or just looking for guidance, here are some helpful links to get you started.

What are the benefits of VIP Membership?
VIP members get exclusive access to these proven and tested premium indicators: Buy the Dip, Advanced Market Moves 2.0, Take Profit, and Volatility Trading Range. In addition, VIP members get access to over 50 VIP-only custom indicators, add-ons, and strategies, private VIP-only forums, private Discord channel to discuss trades and strategies in real-time, customer support, trade alerts, and much more. Learn all about VIP membership here.
How can I access the premium indicators?
To access the premium indicators, which are plug and play ready, sign up for VIP membership here.
Back
Top