There are Three Types of Alerts:Is there a way to add an alert to notify me when this is triggered?
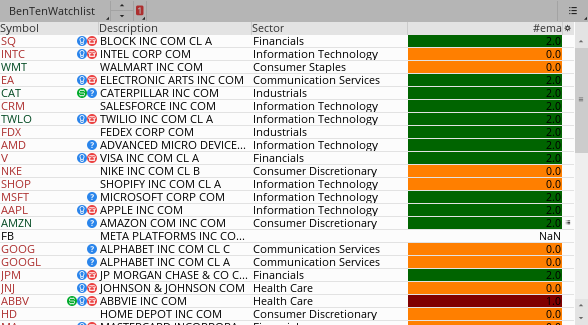
I am using this in the MarketWatch of ToS.
Thank you for the Guidance. I had to make some slight changes to the code you posted, and it works great now. I used the following code:
Code:def EMA8 = ExpAverage(close, 8); def EMA13 = ExpAverage(close, 13); def EMA21 = ExpAverage(close, 21); def EMA34 = ExpAverage(close, 34); def EMA55 = ExpAverage(close, 55); def EMA89 = ExpAverage(close, 89); def bullish = EMA8 CROSSES ABOVE EMA13 and EMA13 > EMA21 and EMA21 > EMA34 and EMA34 > EMA55 and EMA55 > EMA89; def bearish = EMA8 CROSSES BELOW EMA13 and EMA13 < EMA21 and EMA21 < EMA34 and EMA34 < EMA55 and EMA55 < EMA89;
1. There are alerts written into studies. They only alert when the chart w/ the study is open on your screen
They cannot be sent to phone/email. They cannot have custom sounds.
2. There are alerts created on a chart for one specific stock that you want to alert on.3. There are scanned watchlist alerts which alert whenever the results of the scan changes.
These alerts can be 3min delayed. They can have custom sounds, they can be sent to phone/email, if you have notifications turned on in the app setup.
1. The alert written into a study
add to the bottom of your script:
Ruby:
# Alert
Alert(bullish, "bullish", Alert.Bar, Sound.Chimes);
Alert(bullish, "bearish", Alert.Bar, Sound.Chimes);
2. Alert created on a chart:
change def bullish to plot bullish
right-click on chart.
click on create alert
cut&paste your script
3. Scanned watchlist alert
change def bullish to plot bullish
open Scan Hacker
cut&paste your script
click on the menu icon above the results and click on alerts