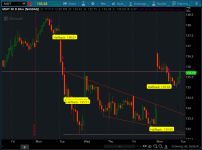
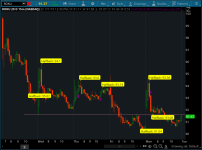
Ever heard the theory that when you get a momentum move in price that it will always snap back halfway? Well, I wrote a thinkscript study that looks for two momentum bars up or down and then calculates what the half back value and prints it on the candle, giving you a suggestion for the upcoming target reversal. The purple arrows are NOT "buy/sell" trade indicators, they are painted when the script notices momentum bars moving up or down, telling you that the next bar will probably be a reversal bar and a bubble to give you a target. This is a simple script. Use other data and some common sense before trading with it.
thinkScript Code
Code:
# This study will plot the half back target after two successive momentum candles up or down.
# ZackH 1.22.2016

input BubblesOn = yes;  #hint BubblesOn:  Turns the bubbles on or off.
input LabelsOn = yes;   #hint labelsOn:  Turns the labels on or off.
input length = 20;      #hint length: The number of bars back to evaluate the study.

# If two momentum candles down, print an arrow on the second.
def IsLongBlack = IsLongBlack(length);
plot TwoLongBlack = IsLongBlack[1] and
                    IsLongBlack;
TwoLongBlack.SetPaintingStrategy(PaintingStrategy.BOOLEAN_ARROW_DOWN);
TwoLongBlack.SetDefaultColor(Color.plum);
TwoLongBlack.SetLineWeight(3);

#Calculate halfback using open, high, low, close divided by 4 for previous 2 bars, then divide that by 2.
def halfback = round((OHLC4[1] + OHLC4[2])/2,2);

# Add a label and chart bubble if enablde to show the halfback value for the current event.
addlabel(labelsOn && TwoLongBlack[1], "Halfback: " + halfback, color.YELLOW);
AddChartBubble(bubbleson && TwoLongBlack[1], low + ticksize(), "Halfback: " + halfback , Color.Yellow, no);

# If two momentum candles up, print an arrow on the second.
def IsLongWhite = IsLongWhite(length);
plot TwoLongWhite = IsLongWhite[1] and
                    IsLongWhite;
TwoLongWhite.SetPaintingStrategy(PaintingStrategy.BOOLEAN_ARROW_UP);
TwoLongWhite.SetDefaultColor(Color.plum);
TwoLongWhite.SetLineWeight(3);

# Add a label and chart bubble if enablde to show the halfback value for the current event.
addlabel(LabelsOn && TwoLongWhite[1], "Halfback: " + halfback, color.YELLOW);
AddChartBubble(bubbleson && TwoLongWhite[1], high + ticksize(), "Halfback: " + halfback , Color.Yellow, yes);
Shareable Link
https://tos.mx/kCk2JeRegarding backtesting of this indicator:
- Question: How can you apply this study and backtest?
- Answer: The best backtests are those that are done manually one signal at a time, especially if you are a chart reader.
Credit: