Greetings,
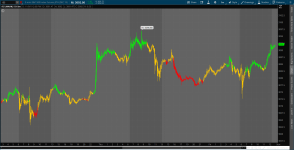
The Market Phases indicator is based off of Chuck Dukas Trend Advisor model of identifying what phase a stock is in. Whether is is bullish, bearish, accumulation, distribution etc. I have attached an image below so you can see. With this indicator, you can scan for stocks in all six phases as well as pullbacks to a fast user chosen ema if a stock is under a bullish or bearish phase. I have included a watchlist column so you can use to your liking. Hope this helps.
Please note: On the chart indicator, when you load it, uncheck the show plots for buphase, acphase, rephase, bephase, dphase, wphase. These mess up the chart sizing. If someone knows how to turn those off by default then please do so. Thank you.

Main Indicator Below
Below is the watchlist column.
shared watchlist column link: https://tos.mx/r1iYDI3 Click here for --> Easiest way to load shared links
The Market Phases indicator is based off of Chuck Dukas Trend Advisor model of identifying what phase a stock is in. Whether is is bullish, bearish, accumulation, distribution etc. I have attached an image below so you can see. With this indicator, you can scan for stocks in all six phases as well as pullbacks to a fast user chosen ema if a stock is under a bullish or bearish phase. I have included a watchlist column so you can use to your liking. Hope this helps.
Please note: On the chart indicator, when you load it, uncheck the show plots for buphase, acphase, rephase, bephase, dphase, wphase. These mess up the chart sizing. If someone knows how to turn those off by default then please do so. Thank you.
Main Indicator Below
Rich (BB code):
#Trend Advisor Market Phases;

#Credit to the Chuck Dukas for creating the system and for then author of the VolumeTrendLabels whose study was use to create this indicator. Ensure you set the correct aggregation period to then chart, this helps calculate the correct volume and price action.


def O = open;
def H = high;
def C = close;
def L = low;
def V = volume;
def SV = V * (H - C) / (H - L);
def BV = V * (C - L) / (H - L);

# below determines if volume supports the move, adds conviction

AddLabel(yes, "Buyer Vol Strong ", if high > high[1] and low > low[1] and BV*1.05 > SV then Color.GREEN else color.black);

AddLabel(yes, "Seller Vol Strong", if high < high[1] and low < low[1] and SV*1.05 > BV then Color.MAGENTA else color.black);

# below determines if price supports the move

AddLabel(yes, "Price Strong ", if high > high[1] and high [1] > high[2] and low > low[1] and low[1] > low[2] then Color.GREEN else color.black);

AddLabel(yes, "Price Weak", if high < high[1] and high[1] < high[2] and low < low[1] and low[1] < low[2] then Color.MAGENTA else color.black);


declare upper;
input price = close;
input displace = 0;

input avglength = 10; #hint avgLength: Then exponential average length you want to use for your pullback entries.

def fastavg = 50;
def slowavg = 200;


plot fastsma = Average( price, fastavg);
fastsma.SetDefaultColor(Color.Green);

plot slowsma = Average(price, slowavg);
slowsma.SetDefaultColor(Color.Red);

# Bullish criteria define below

# Define criteria for Bullish Phase : close > 50 SMA, close > 200 SMA, 50 SMA > 200 SMA

def bullphase = fastsma > slowsma && price > fastsma && price > slowsma;

# Define criteria for Accumulation Phase : close > 50 SMA, close > 200 SMA, 50 SMA < 200 SMA

def accphase = fastsma < slowsma && price > fastsma && price > slowsma;

# Define criteria for Recovery Phase : close > 50 SMA, close < 200 SMA, 50 SMA < 200 SMA

def recphase = fastsma < slowsma && price < slowsma && price > fastsma;


# Bearish Criteria define below

# Define criteria for Bearish Phase : close < 50 SMA, close < 200 SMA, 50 SMA < 200 SMA

def bearphase = fastsma < slowsma && price < fastsma && price < slowsma;

# Define criteria for Distribution Phase : close < 50 SMA, close < 200 SMA, 50 SMA > 200 SMA

def distphase = fastsma > slowsma && price < fastsma && price < slowsma;

# Define criteria for Warning Phase : close < 50 SMA, close > 200 SMA, 50 SMA > 200 SMA

def warnphase = fastsma > slowsma && price > slowsma && price < fastsma;


# Below conditions are for a possible entry when price touches the fastema

#def pbavg = MovingAverage(Average, price, avglength);

def pbavg = ExpAverage(data = price[-displace], length = avglength);

input bullpullback = yes;  #hint bullpullback: Do you want to display the pullback arrows for bullish fast ema entries.
input bearpullback = yes; #hint bearpullback: Do you want to display the pullback arrows for bearish fast ema entries.

def bullishpb = low < pbavg && open > pbavg;
def bearishpb = high > pbavg && open < pbavg;

def bullpb = bullphase is true && bullishpb is true;
def bearpb = bearphase is true && bearishpb is true;

# Plot Signals
plot bullpb1 = if bullpullback then bullpb else 0;
bullpb1.SetPaintingStrategy(PaintingStrategy.BOOLEAN_ARROW_UP);
bullpb1.SetDefaultColor(Color.CYAN);
bullpb1.SetLineWeight(1);

plot bearpb1 = if bearpullback then bearpb else 0;
bearpb1.SetPaintingStrategy(PaintingStrategy.BOOLEAN_ARROW_DOWN);
bearpb1.SetDefaultColor(Color.red);
bearpb1.SetLineWeight(1);


plot buphase = bullphase is true;
plot acphase = accphase is true;
plot rephase = recphase is true;

plot bephase = bearphase is true;
plot dphase = distphase is true;
plot wphase = warnphase is true;

buphase.hide();
acphase.hide();
rephase.hide();
bephase.hide();
dphase.hide();
wphase.hide();
# Below adds labels to the chart to identify what phase the underlying is in


AddLabel(bullphase, " Bull Phase" , if bullphase is true then Color.GREEN else Color.BLACK);

AddLabel(accphase, " Accumation Phase ", if accphase is true then Color.lIGHT_GREEN else Color.BLACK);

AddLabel(recphase, " Recovery Phase ", if recphase is true then Color.lIGHT_ORANGE else Color.BLACK);

AddLabel(warnphase, " Warning Phase ", if warnphase is true then Color.orANGE else Color.BLACK);

AddLabel(distphase, " Distribution Phase ", if distphase is true then Color.light_red else Color.BLACK);

AddLabel(bearphase, " Bear Phase ", if bearphase is true then Color.red else Color.BLACK);


input colorbars = yes;
assignPriceColor(
if !colorbars then color.current else
if  bullphase then Color.GREEN else
if bearphase then Color.RED else Color.current);


Alert(condition = bullphase[1] == 1 and bullphase == 0, text = "Bull Phase", sound = Sound.Bell, "alert type" = Alert.BAR);
Alert(condition = accphase[1] == 1 and accphase == 0, text = "Accumation Phase", sound = Sound.Bell, "alert type" = Alert.BAR);
Alert(condition = recphase[1] == 1 and recphase == 0, text = "Recovery Phase", sound = Sound.Bell, "alert type" = Alert.BAR);
Alert(condition = warnphase[1] == 1 and warnphase == 0, text = "Warning Phase", sound = Sound.Bell, "alert type" = Alert.BAR);
Alert(condition = distphase[1] == 1 and distphase == 0, text = "Distribution Phase", sound = Sound.Bell, "alert type" = Alert.BAR);
Alert(condition = bearphase[1] == 1 and bearphase == 0, text = "Bear Phase", sound = Sound.Bell, "alert type" = Alert.BAR);
Below is the watchlist column.
shared watchlist column link: https://tos.mx/r1iYDI3 Click here for --> Easiest way to load shared links
Code:
#Trend Advisor Market Phases;

#Credit to the Chuck Dukas for creating the system and for then author of the VolumeTrendLabels whose study was use to create this indicator. Ensure you set the correct aggregation period to then chart, this helps calculate the correct volume and price action.

def agg = getAggregationPeriod();
#input vPeriod = AggregationPeriod.day; #hint vPeriod: Enter the chart time you use here. Required to properly caluclate volume and price strength.

def vPeriod = getAggregationPeriod();

def O = open(period = vPeriod);
def H = high(period = vPeriod);
def C = close(period = vPeriod);
def L = low(period = vPeriod);
def V = volume(period = vPeriod);

def SV = V * (H - C) / (H - L);
def BV = V * (C - L) / (H - L);

# below determines if volume supports the move, adds conviction

AddLabel(yes, "Buyer Vol Strong ", if high > high[1] and low > low[1] and BV*1.05 > SV then Color.GREEN else color.black);

AddLabel(yes, "Seller Vol Strong", if high < high[1] and low < low[1] and SV*1.05 > BV then Color.MAGENTA else color.black);

# below determines if price supports the move

AddLabel(yes, "Price Strong ", if high > high[1] and high [1] > high[2] and low > low[1] and low[1] > low[2] then Color.GREEN else color.black);

AddLabel(yes, "Price Weak", if high < high[1] and high[1] < high[2] and low < low[1] and low[1] < low[2] then Color.MAGENTA else color.black);


declare upper;
input price = close;
input displace = 0;

input avglength = 10; #hint avgLength: Then exponential average length you want to use for your pullback entries.

def fastavg = 50;
def slowavg = 200;


plot fastsma = Average( price, fastavg);
fastsma.SetDefaultColor(Color.Green);

plot slowsma = Average(price, slowavg);
slowsma.SetDefaultColor(Color.Red);

# Bullish criteria define below

# Define criteria for Bullish Phase : close > 50 SMA, close > 200 SMA, 50 SMA > 200 SMA

def bullphase = fastsma > slowsma && price > fastsma && price > slowsma;

# Define criteria for Accumulation Phase : close > 50 SMA, close > 200 SMA, 50 SMA < 200 SMA

def accphase = fastsma < slowsma && price > fastsma && price > slowsma;

# Define criteria for Recovery Phase : close > 50 SMA, close < 200 SMA, 50 SMA < 200 SMA

def recphase = fastsma < slowsma && price < slowsma && price > fastsma;


# Bearish Criteria define below

# Define criteria for Bearish Phase : close < 50 SMA, close < 200 SMA, 50 SMA < 200 SMA

def bearphase = fastsma < slowsma && price < fastsma && price < slowsma;

# Define criteria for Distribution Phase : close < 50 SMA, close < 200 SMA, 50 SMA > 200 SMA

def distphase = fastsma > slowsma && price < fastsma && price < slowsma;

# Define criteria for Warning Phase : close < 50 SMA, close > 200 SMA, 50 SMA > 200 SMA

def warnphase = fastsma > slowsma && price > slowsma && price < fastsma;


# Below conditions are for a possible entry when price touches the fastema

#def pbavg = MovingAverage(Average, price, avglength);

def pbavg = ExpAverage(data = price[-displace], length = avglength);

input bullpullback = yes;  #hint bullpullback: Do you want to display the pullback arrows for bullish fast ema entries.
input bearpullback = yes; #hint bearpullback: Do you want to display the pullback arrows for bearish fast ema entries.

def bullishpb = low < pbavg && open > pbavg;
def bearishpb = high > pbavg && open < pbavg;

def bullpb = bullphase is true && bullishpb is true;
def bearpb = bearphase is true && bearishpb is true;

# Plot Signals
plot bullpb1 = if bullpullback then bullpb else 0;
bullpb1.SetPaintingStrategy(PaintingStrategy.BOOLEAN_ARROW_UP);
bullpb1.SetDefaultColor(Color.CYAN);
bullpb1.SetLineWeight(1);

plot bearpb1 = if bearpullback then bearpb else 0;
bearpb1.SetPaintingStrategy(PaintingStrategy.BOOLEAN_ARROW_DOWN);
bearpb1.SetDefaultColor(Color.red);
bearpb1.SetLineWeight(1);


plot buphase = bullphase is true;
plot acphase = accphase is true;
plot rephase = recphase is true;

plot bephase = bearphase is true;
plot dphase = distphase is true;
plot wphase = warnphase is true;


# Below adds labels to the chart to identify what phase the underlying is in


AddLabel(bullphase, " Bull Phase" , if bullphase is true then Color.GREEN else Color.BLACK);

AddLabel(accphase, " Accumation Phase ", if accphase is true then Color.lIGHT_GREEN else Color.BLACK);

AddLabel(recphase, " Recovery Phase ", if recphase is true then Color.lIGHT_ORANGE else Color.BLACK);

AddLabel(warnphase, " Warning Phase ", if warnphase is true then Color.orANGE else Color.BLACK);

AddLabel(distphase, " Distribution Phase ", if distphase is true then Color.light_red else Color.BLACK);

AddLabel(bearphase, " Bear Phase ", if bearphase is true then Color.red else Color.BLACK);


assignPriceColor(if bullphase then Color.GREEN else if bearphase then Color.RED else Color.orange);
Last edited by a moderator: