#Original labels code from Markos and Bobomatic https://usethinkscript.com/threads/market-internals-labels-for-thinkorswim.833/
# Modified by MTG 10/2023 to include $TRIN, $Put/Call ratio, Vix for Futures, Percent of SP500 stocks trading above their (50, 100, and 200)day averages, and $TICK for SP500 - 10/2023
##############################################################
# Weighted A/D
# concept from shadowtrader.net
# coded by TWOO
# https://www.spglobal.com/spdji/en/indices/equity/sp-500/#data
# sector-breakdown
# modified by CWPARKER23
# modifiedTrueRange by Sam4COK @ 07/2022
# modified by MTG to show full sector name and include Overall ratio sum 9/2023
###############################################################
input market = {default NYSE, NASDAQ, SP};
input open_time = 930;
input length = 12;
input ShowLabel = yes;
def price1 = close(symbol = "/vx", period = AggregationPeriod.DAY);
input length1 = 45; #SMA length for VIX of futures
input displace1 = 0;
def SMA1 = Average(price1[-displace1], length1);
# Market Internal Labels
input SYMB = "$ADSPDc"; #Hint SYMB:$ADSPD for SP500 Adv-Decline Issues - composites include the data from all exchanges
input SYMB2 = "$TIKSPc"; #Hint SYMB2:$tIKSP for SP500 Tick
input Symb3 = "$TRINSPc"; #Hint symb: $TrinSp for SP500 Trin
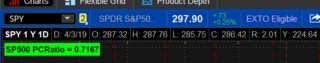
input Symb4 = "$PCSP"; #Hint symb: $PCSP Put/Call Ratio SP500
input Symb5 = "$ADVSPC"; #Hint symb: $ADVSPC Advance Issues Composite SP500 Trin
input Symb6 = "$DECLSPC"; #Hint symb: $DECLSPC Decline Issues SP500
input symb7 = "/vx"; #Hint symb: /vx is volatility index
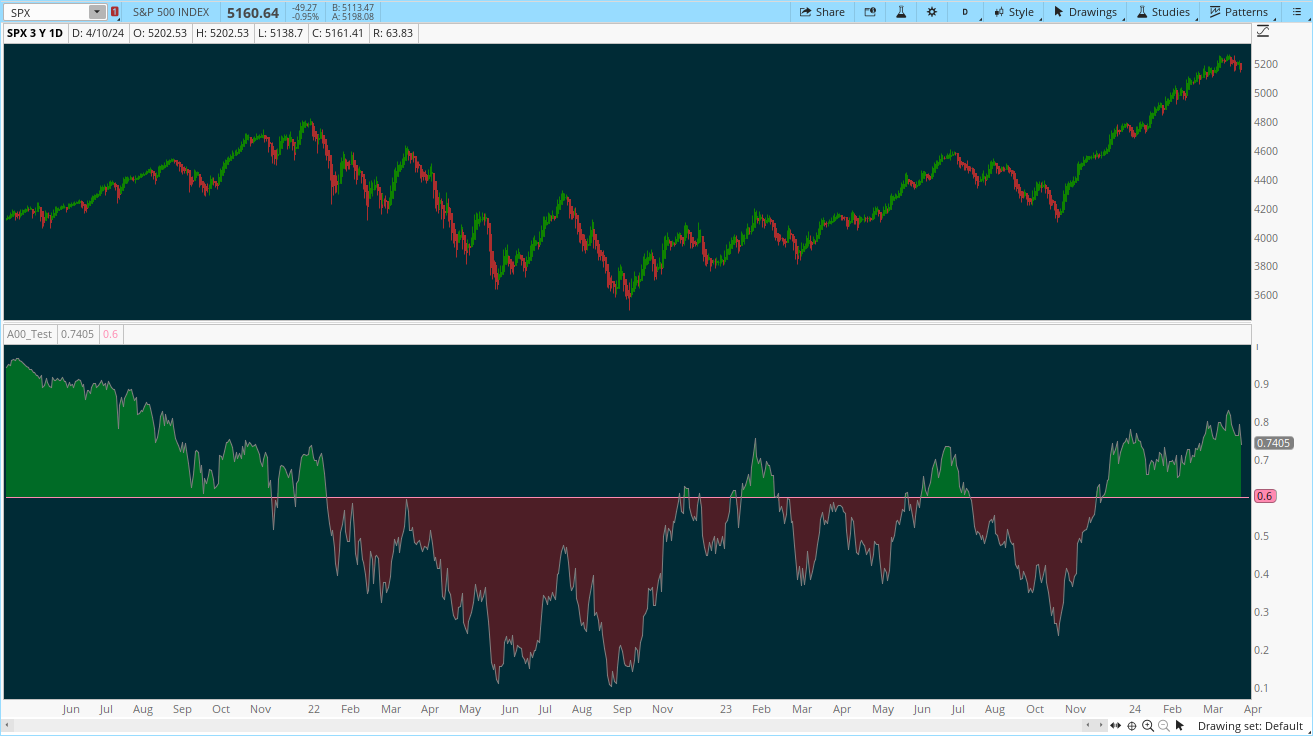
input symb8 = "$SPXA50R"; #Hint this is the percent of SP500 Stocks trading above their 50 day average
input symb9 = "$SPXA100R"; #Hint this is the percent of SP500 Stocks trading above their 100 day average
input symb10 = "$SPXA200R"; #Hint this is the percent of SP500 Stocks trading above their 200 day average
input InformationTechnology = 26.8; # xlkwt
input HealthCare = 15.1; # xlvwt
input Financials = 10.8; # xlfwt
input ConsumerDiscretionary = 10.5; # xlywt
input Communications = 8.9; # xlcwt
input Industrials = 7.8; # xliwt
input ConsumerStaples = 7.0; # xlpwt
input Energy = 4.4; # xlewt
input Utilities = 3.1; # xluwt
input RealEstate = 2.9; # xlrewt
input Materials = 2.6; # xlbwt
def na = Double.NaN ;
def SectorCount = 11;
def Scale = 5000;
def displace = 0;
#### COLORS
DefineGlobalColor("Bullish", Color.CYAN);
DefineGlobalColor("Bearish", Color.PINK);
DefineGlobalColor("Channel", CreateColor(100, 181, 246));
#SP500 ETF sectors percent change
script PC {
input Symbol = "SPX";
def isFirstBar = GetTime() == RegularTradingStart(GetYYYYMMDD()) + 1;
def O = if isFirstBar then close(Symbol) else O[1];
def C = close(Symbol);
plot PctChg = (C - O) / O;
}
def xlkPctChg = PC("XLK");
def xlyPctChg = PC("XLY");
def xlvPctChg = PC("XLV");
def xlfPctChg = PC("XLF");
def xlcPctChg = PC("XLC");
def xliPctChg = PC("XLI");
def xlpPctChg = PC("XLP");
def xlrePctChg = PC("XLRE");
def xlePctChg = PC("XLE");
def xlbPctChg = PC("XLB");
def xluPctChg = PC("XLU");
def xlkSizing = xlkPctChg * InformationTechnology;
def xlvSizing = xlvPctChg * HealthCare;
def xlySizing = xlyPctChg * ConsumerDiscretionary;
def xlfSizing = xlfPctChg * Financials;
def xlcSizing = xlcPctChg * Communications;
def xliSizing = xliPctChg * Industrials;
def xlpSizing = xlpPctChg * ConsumerStaples;
def xleSizing = xlePctChg * Energy;
def xlreSizing = xlrePctChg * RealEstate;
def xlbSizing = xlbPctChg * Materials;
def xluSizing = xluPctChg * Utilities;
def combinedSizing = Scale * (
xlkSizing +
xlvSizing +
xlySizing +
xlfSizing +
xlcSizing +
xliSizing +
xlpSizing +
xleSizing +
xlreSizing +
xlbSizing +
xluSizing
) / SectorCount;
# Weighted_AD
def Weighted_AD = if !IsNaN(combinedSizing) then combinedSizing else na;
# SPX Non_Weighted_AD
def spxcombinedSizing = Scale *
(xlkPctChg +
xlvPctChg +
xlyPctChg +
xlfPctChg +
xlcPctChg +
xliPctChg +
xlpPctChg +
xlePctChg +
xlrePctChg +
xlbPctChg +
xluPctChg);
#SP500 ETF sectors BUBBLE
script pct {
input Symbol = "SPX";
def aggregationPeriod = AggregationPeriod.DAY;
def price = open(Symbol, period = aggregationPeriod);
def diff = close (Symbol) - open(Symbol, period = aggregationPeriod);
plot d_pct = 100 * diff / price;
}
def XLK_d_pct = pct(“XLK”) ;
def XLV_d_pct = pct(“XLV”) ;
def XLY_d_pct = pct(“XLY”) ;
def XLC_d_pct = pct(“XLC”) ;
def XLF_d_pct = pct(“XLF”) ;
def XLI_d_pct = pct(“XLI”) ;
def XLP_d_pct = pct(“XLP”) ;
def XLRE_d_pct = pct(“XLRE”) ;
def XLB_d_pct = pct(“XLB”) ;
def XLU_d_pct = pct(“XLU”) ;
def XLE_d_pct = pct(“XLE”) ;
# 11 Sector total percent values
def SumOfPctValues = XLK_d_pct + XLV_d_pct + XLY_d_pct + XLC_d_pct + XLF_d_pct + XLI_d_pct + XLP_d_pct + XLRE_d_pct + XLB_d_pct + XLU_d_pct + XLE_d_pct;
def UVOLSP = close("$UVOLSPc");
def DVOLSP = close("$DVOLSPc");
def Data = close("$ADSPDc");
# Calculate secondary periods
def AD = close(symbol = SYMB, period = AggregationPeriod.DAY);
def TK = close(symbol = SYMB2, period = AggregationPeriod.DAY);
def TR = close(symbol = Symb3, period = AggregationPeriod.DAY);
def PutCall = close(symbol = Symb4, period = AggregationPeriod.DAY);
def VX = close (symbol = symb7, period = AggregationPeriod.DAY);
def SP50 = close (symbol = symb8, period = AggregationPeriod.DAY);
def SP100 = close (symbol = symb9, period = AggregationPeriod.DAY);
def SP200 = close (symbol = symb10, period = AggregationPeriod.DAY);
# Calculate AD2 with aggregation period DAY
def AD2 = close(Symb5, period = AggregationPeriod.DAY) / close(Symb6, period = AggregationPeriod.DAY);
# SP Breadth ratio
def SPratio = if (UVOLSP >= DVOLSP) then (UVOLSP / DVOLSP) else -(DVOLSP / UVOLSP);
# Add Labels
#Weighted A/D Ratio
AddLabel(ShowLabel, "Weighted A/D SP500: " + Round(SumOfPctValues, 2), (if SumOfPctValues > 0 then Color.GREEN else if SumOfPctValues < 0 then Color.RED else Color.YELLOW));
#Unweighted A/D ratio
AddLabel(yes, " A/D S&P500: " + AD2, if AD2 >= 0 then Color.GREEN else Color.RED);
# A/D value
AddLabel(yes, "A/D SP500: " + AD, if AD >= 0 then Color.GREEN else Color.RED);
#Tick for SP500
AddLabel(yes, "TikSP: " + TK, if TK >= 0 then Color.GREEN else Color.RED);
#Trin for SP500
AddLabel(yes, "TrinSP: " + TR, if TR >= 1.3 then Color.RED else if TR <= .6 then Color.GREEN else Color.YELLOW);
#Put/Call Ratio for SP500
AddLabel(yes, "Put/Call Ratio SP500: " + PutCall, if putcall >= 1 then Color.RED else if putcall <= .1 then Color.GREEN else Color.YELLOW);
#Up/Down Volume for SP500
AddLabel(yes, Concat(Round(SPratio, 2), " :SP Vol"), if SPratio >= 0 then Color.GREEN else Color.RED);
#Vix for Futures
AddLabel(yes, "VIX SP500: " + vx, if vx >= sma1 then Color.cyan else if vx <= sma1 then Color.yellow else Color.YELLOW);
#Percent of SP500 stocks trading above 50 day average
AddLabel(yes, " SP(50)Day: " + sp50, if sp50>= 0 then Color.GREEN else Color.RED);
#Percent of SP500 stocks trading above 100 day average
AddLabel(yes, " SP(100)Day: " + sp100, if sp100>= 0 then Color.GREEN else Color.RED);
#Percent of SP500 stocks trading above 200 day average
AddLabel(yes, " SP(200)Day: " + sp200, if sp200 >= 0 then Color.GREEN else Color.RED);
#End Code


")